Yahoo Finance markets and data editor Jared Blikre breaks down the biggest market themes from today’s trading day, including the activity in micro-cap stocks, volatility (^VIX), and price trends in cryptocurrencies bitcoin (BTC-USD) and ethereum (ETH-USD).
To watch more expert insights and analysis on the latest market action, check out more Asking for a Trend.
00:00 Speaker A
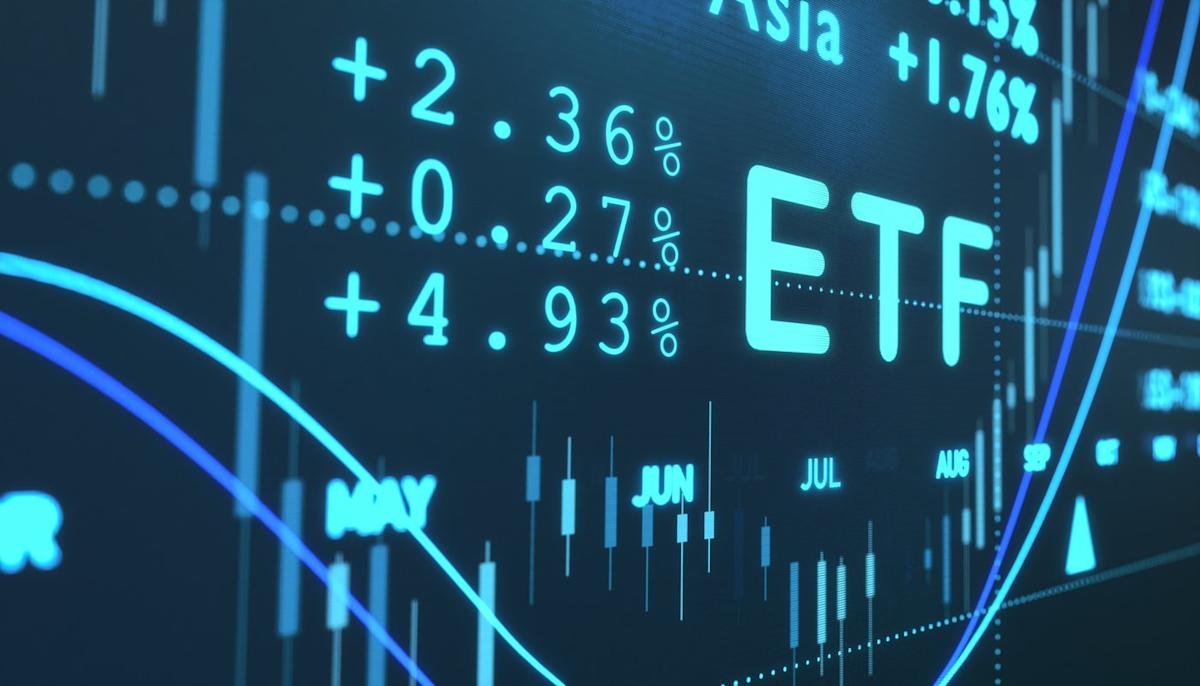
Something interesting happening in the market here. I noticed that small caps closed at a record high, but then I went to the micro caps, which are even smaller, and they closed at their first record high since 2021. So we’ve seen since that’s Friday sell off, small caps came roaring back the most. and now micro craps, uh micro caps, excuse me, uh exceeded even them today in performance. So let’s take a quick look at some of the performance today. Here’s iShares Microcrap ETF IWC, that is up 1.6%, let’s call that. Then we got iShares Russell 2000 ETF, that’s up 1%. and then for the large caps, we’ll use the S&P 500 Spy, that was up 44 basis points. I don’t know if it lasts, but I thought it was interesting. And before we move on, we’re going to talk about volatility, but I just want to show you a picture of the VIx first because this is something I kind of mentioned at the beginning of the 3:00 p.m. hour. You can see it’s still at a 20 level. Uh wow, this is a multi-year chart. I only need to show the last five days.
01:27 Speaker A
And you can see it, it’s been hovering around above 20 for the most part over these last few days. That just shows you that institutions are still betting that there’s going to be more potential volatility um, in the future over the next 30 days. This is not retail hedging demand. This is institutional. And so that’s kind of what we’re taking a look at right here.
02:00 Speaker B
So what are we watching out for now? What’s on the radar?
02:02 Speaker A
Well, fortunately, I had the chance to sit down with Chris Versace, who was on our
02:09 Speaker B
Smart guy.
02:09 Speaker A
Yes, he is. And uh, so we he’s from Thematica Research. He’s very good in the themes. We talked a lot about AI, but we started off the show talking about all the things that are potentially going on in the market right now. Turns out there’s a lot. Let’s take a listen.
02:40 Chris Versace
It it just seems to me that we’re going to hear more of this until we actually get to the expected meeting between Trump and Xi later this month. It’s kind of a negotiation before the negotiation if you will, kind of are you up for this sort of a thing? So, so there is that. We’re starting to get bank earnings which so far have been very good, investment bank
03:10 Chris Versace
making really kind of coming through like people thought. But we still have a we still have a shutdown and it looks like it’s going to continue. And that’s going to start raising questions not only about the IPO market, but about um consumer spending as you know, those furloughs are extended and if we get more massive layoffs,
03:20 Speaker B
Mhm.
03:21 Chris Versace
that could be a problem too.
03:22 Speaker A
So, yeah, so just a quick reminder, October is a month when volatility peaks. I’m talking about the VIX there. And so we’ve seen a lot of that historical action and I think traders, especially on Wall Street have their antenna are up and they’re very kind of sensitive to these potential market catalysts. So the worst may not be over yet. I’m not expecting disaster, but we could see more volatility spikes.
03:52 Speaker B
Gonna do a quick, uh, crypto check?
03:54 Speaker A
Let us do that. Crypto is range bound. I feel like I’ve been saying this forever because it’s kind of been that way forever. It a Bitcoin has looked like it’s about to break out. It’s reached new nominal highs a few times, but it has basically stayed in this trading range. So let’s get the three month chart out and there we go. We’ve been up, we’ve been down. Uh this was a record high but it was very short lived and now we have come right back down to the uh lower end of the range here. I think 108 to 110 is what I’ve been saying in here as the potential support, what I’d want to see hold is support. and so that’s exactly what we’ve seen happen. Here’s the candlestick chart. you can see whenever you see one of these skinny bars here, that’s called a wick or a shadow, that means the an area was quickly rejected and so that indicates support there. That’s what I like to see. That’s why I look at candlesticks. Now taking a look at Ether, I haven’t done this in a while. Let me show you a two-year chart and this is another market that’s been kind of range bound. So we uh this was uh coming back, I’m going to show you a longer term chart, but this was testing a much earlier high, but basically this is at the lower end of a much smaller range. Then you plug in the five year and you can see all this thing has done over the last five years is basically trade sideways. So
05:27 Speaker A
go figure, we got some work to do. We need a catalyst in crypto.
05:32 Speaker B
All right, thank you, brother. Appreciate it.