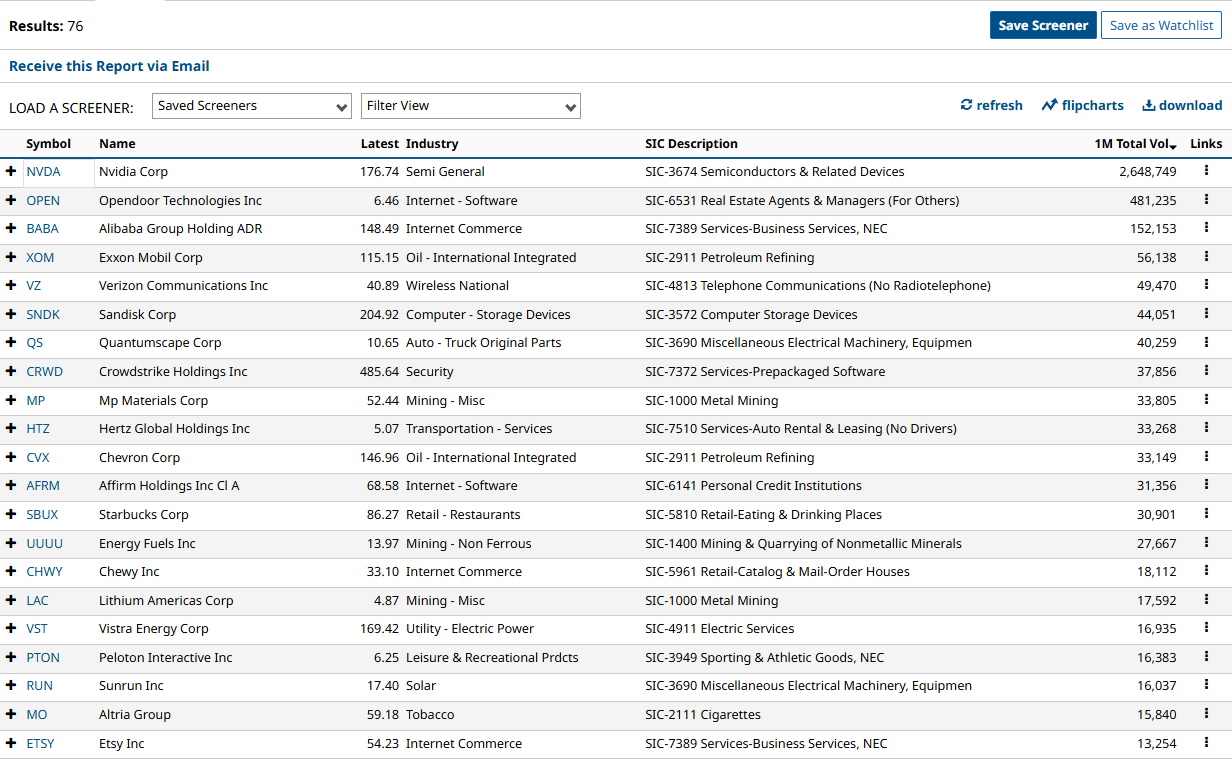
Pulling up today’s results from Barchart’s investing ideas page,u00a0TTM Squeeze Triggered, highlights exactly this mood in the market. This list represents squeeze candidates whose Bollinger Bands are compressed within their Keltner Bands.
The screen applied below filters the results to show only those stocks with an active options market. The results show a mixed bag of sectors and industries just inside the top 10: semiconductors; software; oil, communications; autos; cybersecurity; and mining stocks.u00a0

But what I found particularly interesting is that their charts look eerily similar u2013 i.e., thereu2019s a recent top, a minor drawback, and a period of considerable consolidation.u00a0
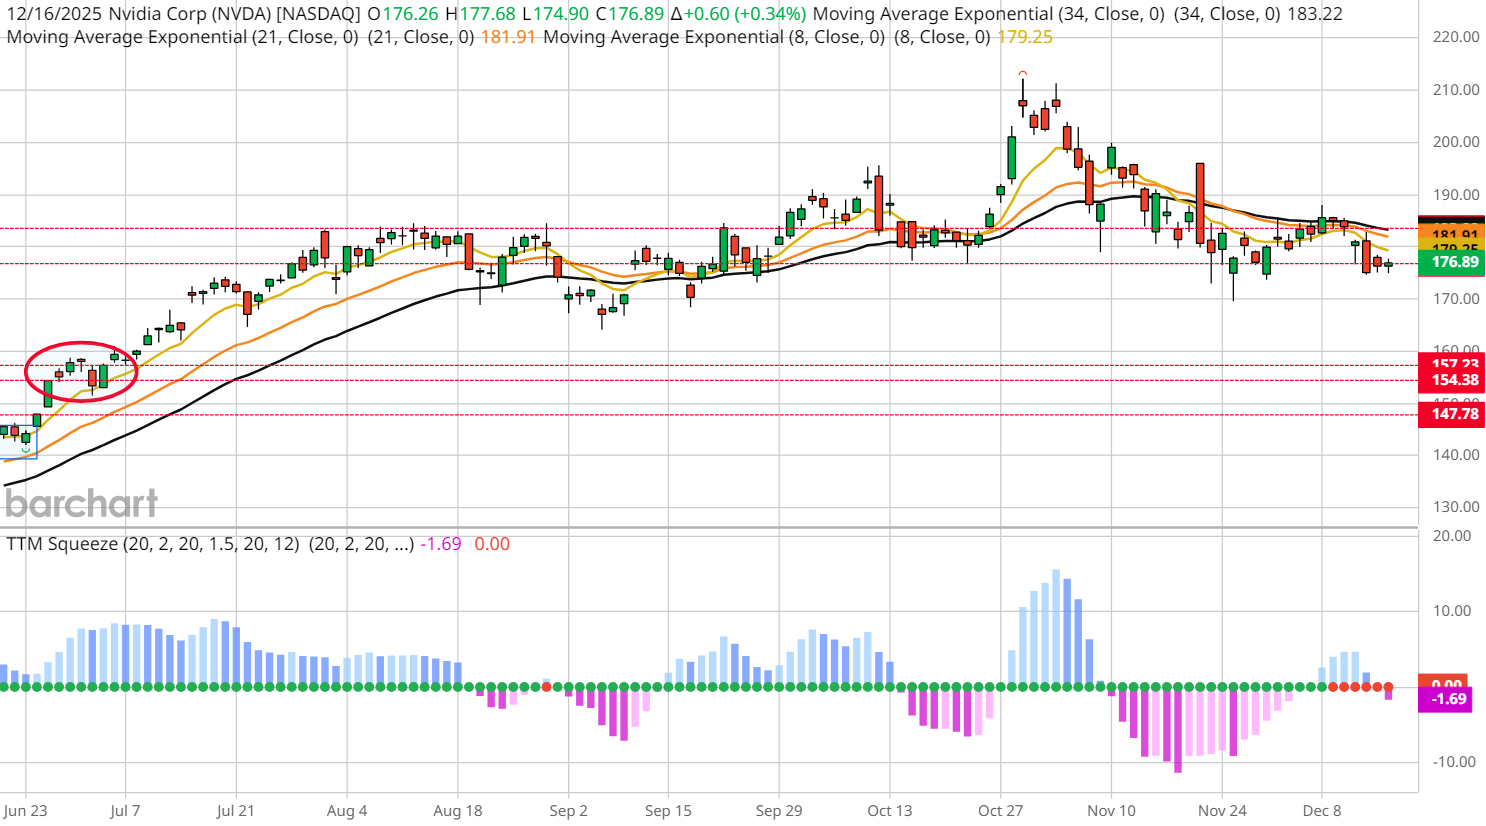
Utilizingu00a0Barchart’s TTM Squeeze Chart Template, the technical trader will also notice that many of these stocks are also trading at or below their intermediate exponential moving averages, such as the 34-day EMA.

This could indicate two potential outcomes. The broader market is waiting for a new catalyst to propel prices out of the current range, and recent activity is leaning toward a move to the downside. However, assumptions are dangerous in trading, and only a “firing” of the TTM Squeeze indicator can confirm a new period of volatility (in other words, directional movement).
But what this indicator is telling me currently is that itu2019s not yet the time to commit new capital to the market, and sitting on my hands might be the best trading plan right now.
u2013 John Rowland, CMT, is Barchartu2019s Senior Market Strategist and host ofu00a0Market on Close.
n
n On the date of publication,nn Barchart Insightsnn did not have (either directly or indirectly) positions in any of the securities mentioned in this article. All information and data in this article is solely for informational purposes.n n For more information please view the Barchart Disclosure Policynn here.n“,”symbols”:[],”related”:[{“id”:”36658233″,”title”:”This High-Yield Dividend Stock Trades at a Third of Its Record Highs: Is It a Buy for 2026?”,”slug”:”this-high-yield-dividend-stock-trades-at-a-third-of-its-record-highs-is-it-a-buy-for-2026″,”feedName”:”Barchart”,”published”:”43 minutes ago”,”categories”:[“STK.EVNT.DIV”,”STK.EQY”]},{“id”:”36656134″,”title”:”Elon Musk Warns He Wants to u2018Slow Down AI and Roboticsu2019 But Says Itu2019s Impossible and u2018Advancing at a Very Rapid Paceu2019″,”slug”:”elon-musk-warns-he-wants-to-slow-down-ai-and-robotics-but-says-its-impossible-and-advancing-at-a-very-rapid-pace”,”feedName”:”Barchart”,”published”:”Tue Dec 16, 3:58PM CST”,”categories”:[“STK.EQY”]},{“id”:”36654036″,”title”:”Should You Buy the Dip in Alibaba Stock?”,”slug”:”should-you-buy-the-dip-in-alibaba-stock”,”feedName”:”Barchart”,”published”:”Tue Dec 16, 2:33PM CST”,”categories”:[“STK.EQY”]},{“id”:”36653999″,”title”:”Does the Netflix Deal Drama Make NFLX Stock a Steal Here?”,”slug”:”does-the-netflix-deal-drama-make-nflx-stock-a-steal-here”,”feedName”:”Barchart”,”published”:”Tue Dec 16, 2:30PM CST”,”categories”:[“STK.EQY”]},{“id”:”36653938″,”title”:”Europe Is Having a u2018Gut Checku2019 and Dan Ives Says Itu2019s Time to Gobble Up 2 of the Regionu2019s Top Tech Stocks”,”slug”:”europe-is-having-a-gut-check-and-dan-ives-says-its-time-to-gobble-up-2-of-the-regions-top-tech-stocks”,”feedName”:”Barchart”,”published”:”Tue Dec 16, 2:26PM CST”,”categories”:[“STK.EQY”]},{“id”:”36653786″,”title”:”Option Traders Are Pricing a Nearly 22% Move in Tilray Stock Before the End of 2025. Should You Buy, Sell, or Hold TLRY Here?”,”slug”:”option-traders-are-pricing-a-nearly-22-move-in-tilray-stock-before-the-end-of-2025-should-you-buy-sell-or-hold-tlry-here”,”feedName”:”Barchart”,”published”:”Tue Dec 16, 2:14PM CST”,”categories”:[“STK.TRD”,”STK.EQY”,”STK.OPT”,”FUT.OPT”]},{“id”:”36653494″,”title”:”39,000 Reasons to Consider Selling Tesla Stock Here”,”slug”:”39-000-reasons-to-consider-selling-tesla-stock-here”,”feedName”:”Barchart”,”published”:”Tue Dec 16, 1:57PM CST”,”categories”:[“STK.EQY”]},{“id”:”36652940″,”title”:”This Robotics Stock Just Hit a Key Milestone. Should You Buy It Here?”,”slug”:”this-robotics-stock-just-hit-a-key-milestone-should-you-buy-it-here”,”feedName”:”Barchart”,”published”:”Tue Dec 16, 1:19PM CST”,”categories”:[“STK.EQY”]}],”sourceId”:”9714604″,”media”:”text”,”thumbnail”:{“url”:”https://media.barchart.com/contributors-admin/common-images/images/Stocks%2C%20Markets%2C%20%26%20Global%20Economy/Charts%2C%20tickers%2C%20traders/Desk%20setup%20looking%20at%20stocks%20by%20LanaStock%20via%20iStock.jpg”,”width”:150,”height”:90,”caption”:”Desk setup looking at stocks by LanaStock via iStock”},”summary”:”Our top chart expert explains that the best move right now is actually no move at all, according to todayu2019s TTM Squeeze filter results.”,”canonicalUrl”:”https://www.barchart.com/story/news/36654657/buy-the-dip-or-panic-sell-what-this-powerful-chart-indicator-is-telling-us-about-the-stock-market-now”,”slug”:”buy-the-dip-or-panic-sell-what-this-powerful-chart-indicator-is-telling-us-about-the-stock-market-now”,”sourceFeed”:”CONT2″,”categories”:[“STK.TRD”,”STK.EQY”,”STK.OPT”,”FUT.OPT”],”meta”:”N/A”,”authorBadge”:null,”raw”:{“id”:”36654657″,”title”:”Buy the Dip, or Panic Sell? What This Powerful Chart Indicator is Telling Us About the Stock Market Now.”,”author”:”Barchart Insights”,”authorUrl”:”https://www.barchart.com/news/authors/456/barchart-insights”,”authorImage”:”https://media.barchart.com/news/authors/456/avatar-fpUViR55KcNCHWBf.png”,”authorType”:”author”,”feed”:”EXCLSV”,”feedName”:”Barchart”,”feedUrl”:”https://www.barchart.com”,”published”:1765919256,”publishedTime”:”2025-12-16 21:07:36″,”updated”:”2025-12-16 21:07:36 +0000″,”image”:{“url”:”https://media.barchart.com/contributors-admin/common-images/images/Stocks%2C%20Markets%2C%20%26%20Global%20Economy/Charts%2C%20tickers%2C%20traders/Desk%20setup%20looking%20at%20stocks%20by%20LanaStock%20via%20iStock.jpg”,”width”:150,”height”:90,”caption”:”Desk setup looking at stocks by LanaStock via iStock”},”content”:”
Theu00a0TTM Squeeze is a powerful volatility indicator that identifies periods of low volatility and anticipates potential breakouts. However, it can also sometimes indicate periods of indecision and a lack of conviction.u00a0
Pulling up today’s results from Barchart’s investing ideas page,u00a0TTM Squeeze Triggered, highlights exactly this mood in the market. This list represents squeeze candidates whose Bollinger Bands are compressed within their Keltner Bands.
The screen applied below filters the results to show only those stocks with an active options market. The results show a mixed bag of sectors and industries just inside the top 10: semiconductors; software; oil, communications; autos; cybersecurity; and mining stocks.u00a0
But what I found particularly interesting is that their charts look eerily similar u2013 i.e., thereu2019s a recent top, a minor drawback, and a period of considerable consolidation.u00a0
Utilizingu00a0Barchart’s TTM Squeeze Chart Template, the technical trader will also notice that many of these stocks are also trading at or below their intermediate exponential moving averages, such as the 34-day EMA.
This could indicate two potential outcomes. The broader market is waiting for a new catalyst to propel prices out of the current range, and recent activity is leaning toward a move to the downside. However, assumptions are dangerous in trading, and only a “firing” of the TTM Squeeze indicator can confirm a new period of volatility (in other words, directional movement).
But what this indicator is telling me currently is that itu2019s not yet the time to commit new capital to the market, and sitting on my hands might be the best trading plan right now.
u2013 John Rowland, CMT, is Barchartu2019s Senior Market Strategist and host ofu00a0Market on Close.
n
n On the date of publication,nn Barchart Insightsnn did not have (either directly or indirectly) positions in any of the securities mentioned in this article. All information and data in this article is solely for informational purposes.n n For more information please view the Barchart Disclosure Policynn here.n“,”symbols”:[],”related”:[{“id”:”36658233″,”title”:”This High-Yield Dividend Stock Trades at a Third of Its Record Highs: Is It a Buy for 2026?”,”slug”:”this-high-yield-dividend-stock-trades-at-a-third-of-its-record-highs-is-it-a-buy-for-2026″,”feedName”:”Barchart”,”published”:”43 minutes ago”,”categories”:[“STK.EVNT.DIV”,”STK.EQY”]},{“id”:”36656134″,”title”:”Elon Musk Warns He Wants to u2018Slow Down AI and Roboticsu2019 But Says Itu2019s Impossible and u2018Advancing at a Very Rapid Paceu2019″,”slug”:”elon-musk-warns-he-wants-to-slow-down-ai-and-robotics-but-says-its-impossible-and-advancing-at-a-very-rapid-pace”,”feedName”:”Barchart”,”published”:”Tue Dec 16, 3:58PM CST”,”categories”:[“STK.EQY”]},{“id”:”36654036″,”title”:”Should You Buy the Dip in Alibaba Stock?”,”slug”:”should-you-buy-the-dip-in-alibaba-stock”,”feedName”:”Barchart”,”published”:”Tue Dec 16, 2:33PM CST”,”categories”:[“STK.EQY”]},{“id”:”36653999″,”title”:”Does the Netflix Deal Drama Make NFLX Stock a Steal Here?”,”slug”:”does-the-netflix-deal-drama-make-nflx-stock-a-steal-here”,”feedName”:”Barchart”,”published”:”Tue Dec 16, 2:30PM CST”,”categories”:[“STK.EQY”]},{“id”:”36653938″,”title”:”Europe Is Having a u2018Gut Checku2019 and Dan Ives Says Itu2019s Time to Gobble Up 2 of the Regionu2019s Top Tech Stocks”,”slug”:”europe-is-having-a-gut-check-and-dan-ives-says-its-time-to-gobble-up-2-of-the-regions-top-tech-stocks”,”feedName”:”Barchart”,”published”:”Tue Dec 16, 2:26PM CST”,”categories”:[“STK.EQY”]},{“id”:”36653786″,”title”:”Option Traders Are Pricing a Nearly 22% Move in Tilray Stock Before the End of 2025. Should You Buy, Sell, or Hold TLRY Here?”,”slug”:”option-traders-are-pricing-a-nearly-22-move-in-tilray-stock-before-the-end-of-2025-should-you-buy-sell-or-hold-tlry-here”,”feedName”:”Barchart”,”published”:”Tue Dec 16, 2:14PM CST”,”categories”:[“STK.TRD”,”STK.EQY”,”STK.OPT”,”FUT.OPT”]},{“id”:”36653494″,”title”:”39,000 Reasons to Consider Selling Tesla Stock Here”,”slug”:”39-000-reasons-to-consider-selling-tesla-stock-here”,”feedName”:”Barchart”,”published”:”Tue Dec 16, 1:57PM CST”,”categories”:[“STK.EQY”]},{“id”:”36652940″,”title”:”This Robotics Stock Just Hit a Key Milestone. Should You Buy It Here?”,”slug”:”this-robotics-stock-just-hit-a-key-milestone-should-you-buy-it-here”,”feedName”:”Barchart”,”published”:”Tue Dec 16, 1:19PM CST”,”categories”:[“STK.EQY”]}],”sourceId”:”9714604″,”media”:”text”,”thumbnail”:{“url”:”https://media.barchart.com/contributors-admin/common-images/images/Stocks%2C%20Markets%2C%20%26%20Global%20Economy/Charts%2C%20tickers%2C%20traders/Desk%20setup%20looking%20at%20stocks%20by%20LanaStock%20via%20iStock.jpg”,”width”:150,”height”:90,”caption”:”Desk setup looking at stocks by LanaStock via iStock”},”summary”:”Our top chart expert explains that the best move right now is actually no move at all, according to todayu2019s TTM Squeeze filter results.”,”canonicalUrl”:”https://www.barchart.com/story/news/36654657/buy-the-dip-or-panic-sell-what-this-powerful-chart-indicator-is-telling-us-about-the-stock-market-now”,”slug”:”buy-the-dip-or-panic-sell-what-this-powerful-chart-indicator-is-telling-us-about-the-stock-market-now”,”sourceFeed”:”CONT2″,”categories”:[“STK.TRD”,”STK.EQY”,”STK.OPT”,”FUT.OPT”],”meta”:null,”authorBadge”:null},”barchartAuthor”:{“id”:0,”following”:false},”contributorsServiceCategories”:[“Options”,”Equities/Stocks”],”isBarchartAuthor”:true,”isContributorOrSyndicated”:false,”isPressRelease”:false,”isSponsoredContent”:false,”shouldLoadMoreNews”:true,”displayCaption”:true,”isFuturesArticle”:false,”shouldShowPlus500Ad”:false,”shareLink”:”https://www.barchart.com/share/news/36654657/buy-the-dip-or-panic-sell-what-this-powerful-chart-indicator-is-telling-us-about-the-stock-market-now”}” data-ng-controller=”NewsItem.newsItemCtrl as vm” data-ng-init=”shareLink=’https://www.barchart.com/share/news/36654657/buy-the-dip-or-panic-sell-what-this-powerful-chart-indicator-is-telling-us-about-the-stock-market-now'”>
Barchart Insights – Barchart – Columnist
All information and data in this article is solely for informational purposes. For more information please view the Barchart Disclosure Policy here

Desk setup looking at stocks by LanaStock via iStock
The TTM Squeeze is a powerful volatility indicator that identifies periods of low volatility and anticipates potential breakouts. However, it can also sometimes indicate periods of indecision and a lack of conviction.
Pulling up today’s results from Barchart’s investing ideas page, TTM Squeeze Triggered, highlights exactly this mood in the market. This list represents squeeze candidates whose Bollinger Bands are compressed within their Keltner Bands.
The screen applied below filters the results to show only those stocks with an active options market. The results show a mixed bag of sectors and industries just inside the top 10: semiconductors; software; oil, communications; autos; cybersecurity; and mining stocks.
But what I found particularly interesting is that their charts look eerily similar – i.e., there’s a recent top, a minor drawback, and a period of considerable consolidation.
Utilizing Barchart’s TTM Squeeze Chart Template, the technical trader will also notice that many of these stocks are also trading at or below their intermediate exponential moving averages, such as the 34-day EMA.
This could indicate two potential outcomes. The broader market is waiting for a new catalyst to propel prices out of the current range, and recent activity is leaning toward a move to the downside. However, assumptions are dangerous in trading, and only a “firing” of the TTM Squeeze indicator can confirm a new period of volatility (in other words, directional movement).
But what this indicator is telling me currently is that it’s not yet the time to commit new capital to the market, and sitting on my hands might be the best trading plan right now.
– John Rowland, CMT, is Barchart’s Senior Market Strategist and host of Market on Close.
On the date of publication, Barchart Insights did not have (either directly or indirectly) positions in any of the securities mentioned in this article. All information and data in this article is solely for informational purposes. For more information please view the Barchart Disclosure Policy here.