Olema Pharmaceuticals (OLMA) is back in focus after fresh analyst coverage with positive ratings and a scheduled presentation at the 44th Annual J.P. Morgan Healthcare Conference, drawing attention to its breast cancer drug pipeline.
See our latest analysis for Olema Pharmaceuticals.
Despite a 7.02% one day share price decline to US$27.14 and a softer recent week, Olema’s 90 day share price return of 249.29% and one year total shareholder return of 379.51% indicate that momentum has been strong around its drug pipeline news, fresh analyst coverage and upcoming conference appearance.
If Olema’s story has you looking across the sector, this could be a good moment to widen your research and check out healthcare stocks as potential next ideas.
With Olema trading at US$27.14 against an average analyst price target of about US$45, and recent gains already very large over the past year, investors may ask whether there is still a buying opportunity here or whether the market is already pricing in future growth.
Price-to-Book of 6.9x: Is It Justified?
At a last close of US$27.14, Olema is trading on a P/B of 6.9x, which lines up with a market view that already prices in substantial expectations compared with peers.
P/B compares a company’s market value to its net assets, which is often used for early stage or unprofitable biopharma names where earnings are not yet a guide.
For Olema, this 6.9x multiple sits well below its peer average of 61.3x. This suggests investors are assigning a lower premium per dollar of book value than to many other biotechs, even though the stock screens as expensive versus the broader US Biotechs industry average of 2.6x.
That gap between peer average and sector average is wide. It highlights how sharply sentiment can differ inside a specialist group like biotech when the story is still driven by clinical milestones rather than profits.
See what the numbers say about this price — find out in our valuation breakdown.
Result: Price-to-book of 6.9x (ABOUT RIGHT)
However, the story still hinges on successful trials and funding, and any clinical setback or tighter capital conditions could quickly challenge today’s valuation and sentiment.
Find out about the key risks to this Olema Pharmaceuticals narrative.
Another View: DCF Says Slight Discount, Not Deep Value
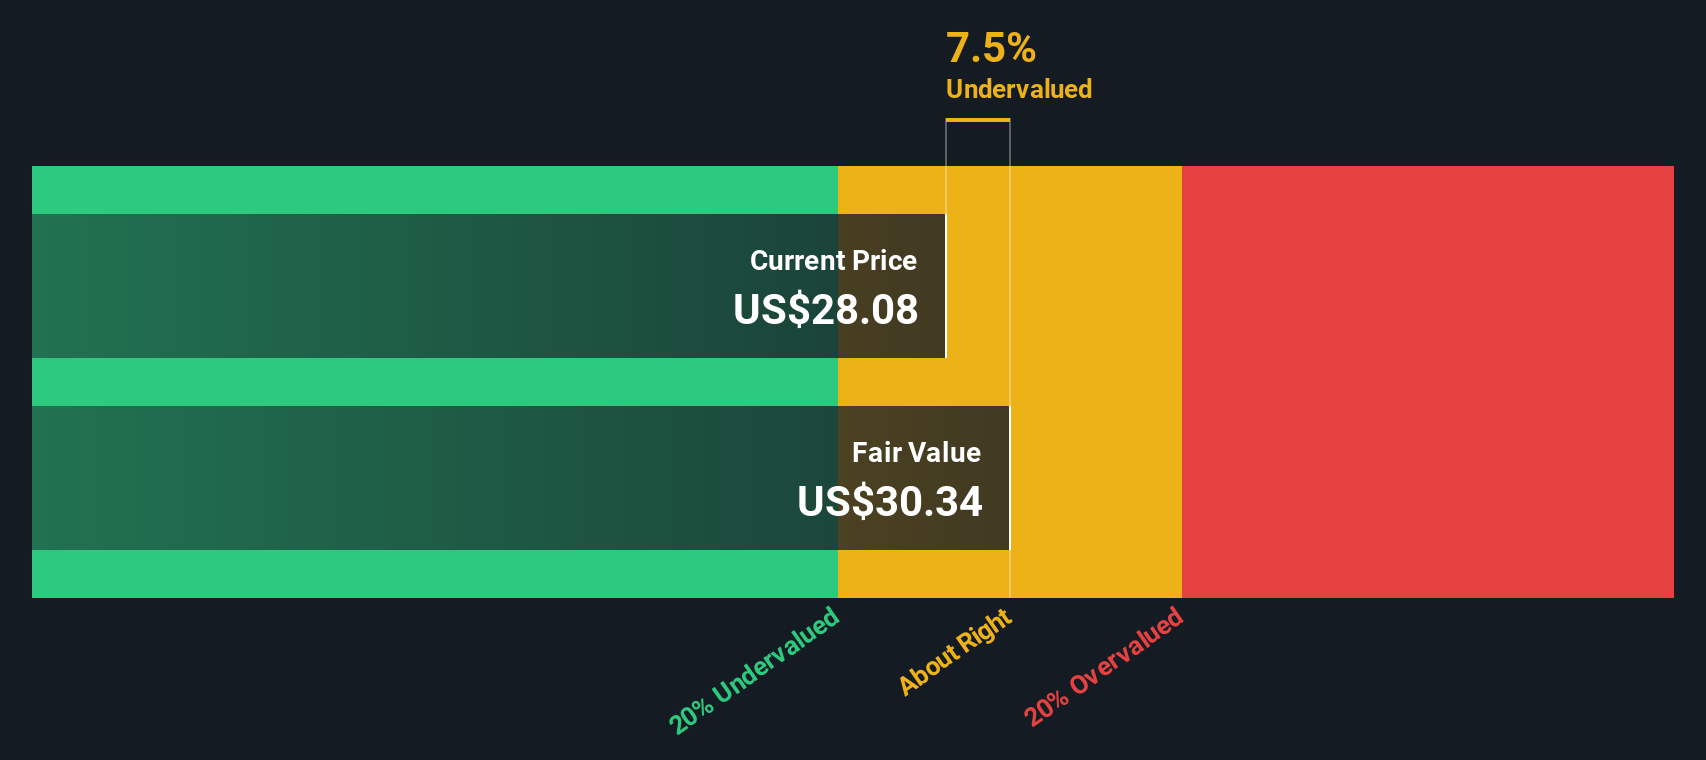
While the 6.9x P/B points to a mixed picture, our DCF model indicates that Olema is trading about 9.4% below its estimated fair value of roughly US$29.97 per share. That is a modest gap, so the key question is whether this small discount is sufficient when considering the clinical and funding risks.
Look into how the SWS DCF model arrives at its fair value.
Simply Wall St performs a discounted cash flow (DCF) on every stock in the world every day (check out Olema Pharmaceuticals for example). We show the entire calculation in full. You can track the result in your watchlist or portfolio and be alerted when this changes, or use our stock screener to discover 873 undervalued stocks based on their cash flows. If you save a screener we even alert you when new companies match – so you never miss a potential opportunity.
Build Your Own Olema Pharmaceuticals Narrative
If you see the numbers differently or prefer to rely on your own work, you can build a personalised Olema view in just a few minutes, starting with Do it your way.
A great starting point for your Olema Pharmaceuticals research is our analysis highlighting 2 key rewards and 4 important warning signs that could impact your investment decision.
Ready to hunt for your next idea?
If Olema interests you, do not stop there. Use the Simply Wall St Screener to quickly spot fresh candidates that fit the kind of opportunities you want.
- Target income potential with these 12 dividend stocks with yields > 3% that may help you build a steadier stream of cash returns.
- Tap into growth themes through these 24 AI penny stocks that are tied to artificial intelligence trends shaping multiple industries.
- Zoom in on value candidates using these 873 undervalued stocks based on cash flows that could offer more attractive pricing based on cash flows.
This article by Simply Wall St is general in nature. We provide commentary based on historical data and analyst forecasts only using an unbiased methodology and our articles are not intended to be financial advice. It does not constitute a recommendation to buy or sell any stock, and does not take account of your objectives, or your financial situation. We aim to bring you long-term focused analysis driven by fundamental data. Note that our analysis may not factor in the latest price-sensitive company announcements or qualitative material. Simply Wall St has no position in any stocks mentioned.
New: AI Stock Screener & Alerts
Our new AI Stock Screener scans the market every day to uncover opportunities.
• Dividend Powerhouses (3%+ Yield)
• Undervalued Small Caps with Insider Buying
• High growth Tech and AI Companies
Or build your own from over 50 metrics.
Have feedback on this article? Concerned about the content? Get in touch with us directly. Alternatively, email editorial-team@simplywallst.com