BlackRock (BLK) is back in focus as investors weigh Rick Rieder’s potential move into the Federal Reserve chair shortlist and CEO Larry Fink’s Davos discussions on AI infrastructure and blockchain based financial modernization.
See our latest analysis for BlackRock.
At a share price of $1,139.72, BlackRock has seen a 1 month share price return of 4.89% and a year to date share price return of 5.04%. Its 1 year total shareholder return of 14.28% and 5 year total shareholder return of 78.49% indicate that performance has changed over these longer periods as Fed chair speculation, Davos appearances and growing attention on digital assets keep the stock in the spotlight.
If policy influence and AI infrastructure themes around BlackRock have caught your eye, this could be a useful moment to look at high growth tech and AI names through high growth tech and AI stocks.
With BlackRock trading at $1,139.72 after strong multi year shareholder returns and fresh attention on AI, crypto and policy influence, investors may ask whether there is still value on the table or whether the market is already pricing in future growth.
Most Popular Narrative: 12.7% Undervalued
Compared with the last close at $1,139.72, the most followed narrative puts BlackRock’s fair value closer to $1,305.93, built on detailed long term modeling.
The analysts have a consensus price target of $1167.2 for BlackRock based on their expectations of its future earnings growth, profit margins and other risk factors. However, there is a degree of disagreement amongst analysts, with the most bullish reporting a price target of $1252.0, and the most bearish reporting a price target of just $1000.0.
Want to see what is sitting behind that fair value gap? The narrative leans on steady revenue expansion, higher margins and a future earnings multiple that assumes BlackRock keeps earning its scale advantage. Curious how those moving parts fit together over the next few years? The full story lays out the numbers and the trade offs in black and white.
Result: Fair Value of $1,305.93 (UNDERVALUED)
Have a read of the narrative in full and understand what’s behind the forecasts.
However, the story can change quickly if fee pressure accelerates or if recent private market acquisitions and tech platforms fail to deliver the earnings power analysts are modeling.
Find out about the key risks to this BlackRock narrative.
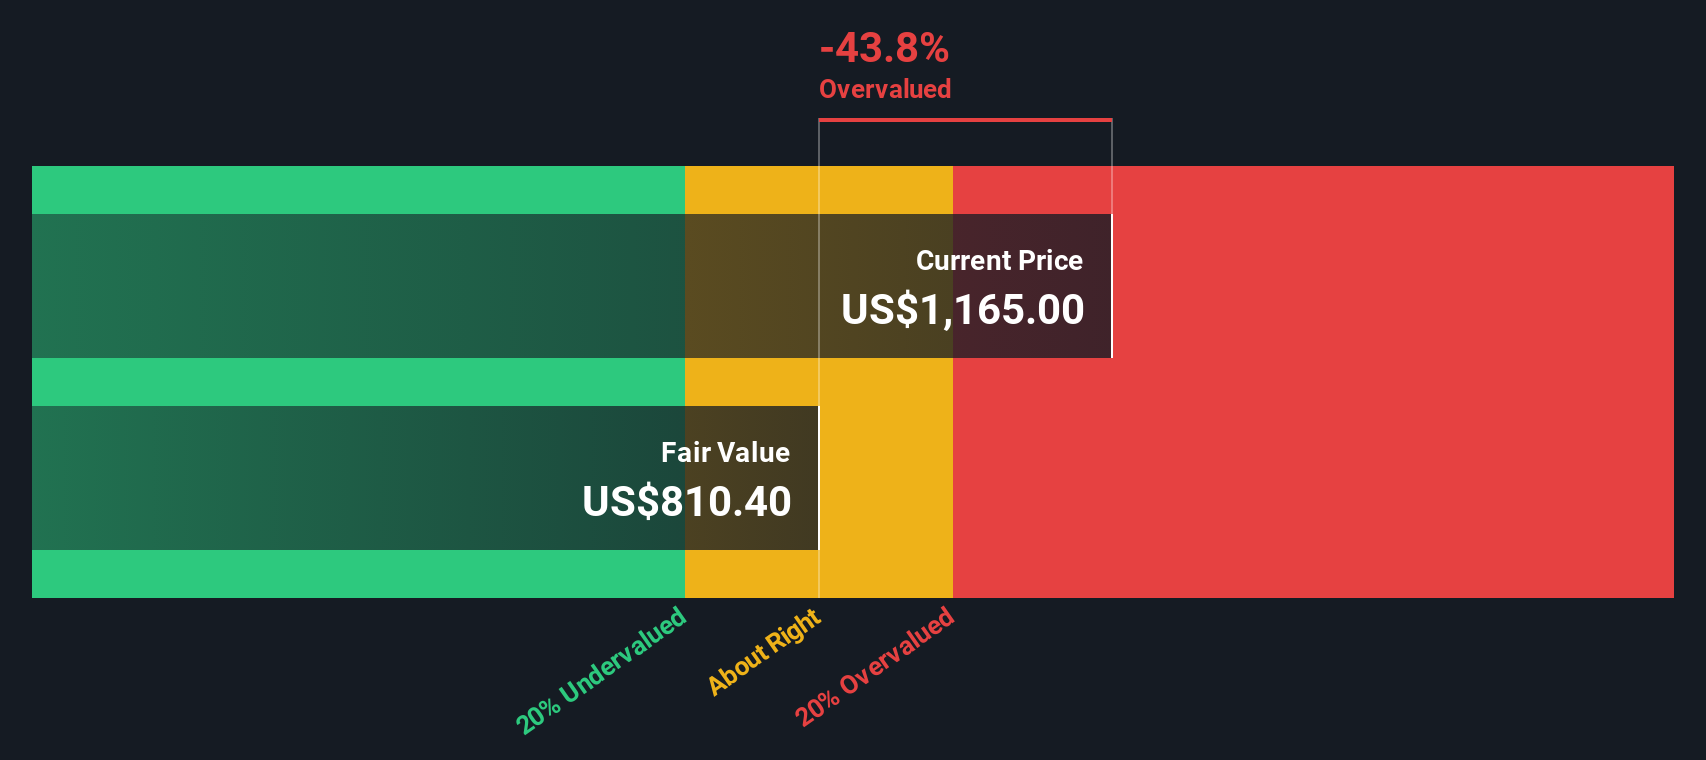
Another View: Our DCF Model Flags Overvaluation
While the popular narrative suggests BlackRock is 12.7% undervalued, our DCF model comes out differently. On those assumptions, the fair value sits near $937.20 per share, which is below the current $1,139.72 price and implies the stock screens as expensive. Which story do you think reflects reality more closely?
Look into how the SWS DCF model arrives at its fair value.
Simply Wall St performs a discounted cash flow (DCF) on every stock in the world every day (check out BlackRock for example). We show the entire calculation in full. You can track the result in your watchlist or portfolio and be alerted when this changes, or use our stock screener to discover 878 undervalued stocks based on their cash flows. If you save a screener we even alert you when new companies match – so you never miss a potential opportunity.
Build Your Own BlackRock Narrative
If you see the numbers differently or prefer to test your own assumptions, you can build a custom view in just a few minutes. Do it your way.
A great starting point for your BlackRock research is our analysis highlighting 1 key reward and 2 important warning signs that could impact your investment decision.
Looking for more investment ideas?
If BlackRock helps frame your thinking but you want a fuller watchlist, do not stop here. Your next strong idea could be one screener away.
- Spot potential value with these 878 undervalued stocks based on cash flows that highlight companies whose prices differ from their underlying cash flow profiles.
- Back emerging themes by scanning these 24 AI penny stocks that focus on businesses tied to artificial intelligence growth.
- Tap into digital asset trends with these 19 cryptocurrency and blockchain stocks featuring companies linked to cryptocurrency and blockchain activity.
This article by Simply Wall St is general in nature. We provide commentary based on historical data and analyst forecasts only using an unbiased methodology and our articles are not intended to be financial advice. It does not constitute a recommendation to buy or sell any stock, and does not take account of your objectives, or your financial situation. We aim to bring you long-term focused analysis driven by fundamental data. Note that our analysis may not factor in the latest price-sensitive company announcements or qualitative material. Simply Wall St has no position in any stocks mentioned.
Valuation is complex, but we’re here to simplify it.
Discover if BlackRock might be undervalued or overvalued with our detailed analysis, featuring fair value estimates, potential risks, dividends, insider trades, and its financial condition.
Have feedback on this article? Concerned about the content? Get in touch with us directly. Alternatively, email editorial-team@simplywallst.com