Key Points
-
Kalshi prediction contracts put the odds of an S&P 500 correction around 58% in 2026.
-
The stock market tends to suffer a steep decline during midterm election years.
-
History says the probability of an S&P 500 bear market is roughly 50% in 2026.
- 10 stocks we like better than S&P 500 Index ›
The S&P 500 (SNPINDEX: ^GSPC) has traded sideways during the first few weeks of 2026, but investors have reason to think the benchmark index will decline sharply at some point this year.
Contracts on the popular prediction market Kalshi predict a stock market correction is more likely than not, and history puts the odds of a bear market at approximately 50% in 2026. Here’s what investors should know.
Will AI create the world’s first trillionaire? Our team just released a report on the one little-known company, called an “Indispensable Monopoly” providing the critical technology Nvidia and Intel both need. Continue »

Image source: Getty Images.
Kalshi prediction contracts puts the odds of an S&P 500 bear market below 39%
Kalshi is a popular exchange where traders can buy and sell prediction contracts based on real-world events. The contracts are binary in nature, meaning traders can either bet Yes (an event will happen) or No (an event will not happen). The payout for a correct prediction is $1, and the payout for an incorrect prediction is $0.
As of Feb. 20, contracts asking whether the S&P 500 will drop to 6,200 or below in 2026 are priced at $0.58 for Yes. That means traders put the probability of that outcome at 58%. In that scenario, the index would decline at least 11% from its record high of 6,979, putting it in market correction territory.
Similarly, Kalshi contracts show a 39% probability that the S&P 500 will drop 15% to 5,900 at some point in 2026. No contracts correlate with a bear market (i.e., a 20% decline), but the odds would be less than 39% at current prices. That’s interesting because history says prediction market traders are underestimating the odds of a bear market.
History puts the odds of an S&P 500 bear market at roughly 50%
The S&P 500 tends to perform poorly in midterm election years. The president’s party almost always loses seats in Congress, which creates uncertainty about the future direction of fiscal, trade, and regulatory policy. Investors don’t know whether the political party in power will lose enough seats to disrupt the status quo, which translates into stock market volatility.
Indeed, the S&P 500 has suffered a median intra-year drawdown of 19% during midterm election years, and the index has performed even worse during midterm years when a new president sits in the White House (i.e., a president who did not hold office in the prior term). Under those conditions, the S&P 500 has suffered a median intra-year drop of 21%.
What does that mean? Median refers to the middle value. So, history says there is a 50% chance the S&P 500 drops at least 21% at some point this year. In other words, the odds of a bear market in 2026 are about 50%, which is much higher than the odds implied by Kalshi prediction contracts.
The stock market typically rebounds quickly after midterm elections
Fortunately, the stock market typically rebounds quickly following midterm elections. In fact, the six-month period after the elections (November through April) has historically been the strongest period of the four-year presidential cycle, according to Carson Investment Research. The S&P 500 has returned an average of 14% during those six months.
Of course, past performance is never a guarantee of future results. How the stock market actually performs in the coming months depends primarily on corporate financial results and sentiment. In that sense, investors find themselves in a challenging position.
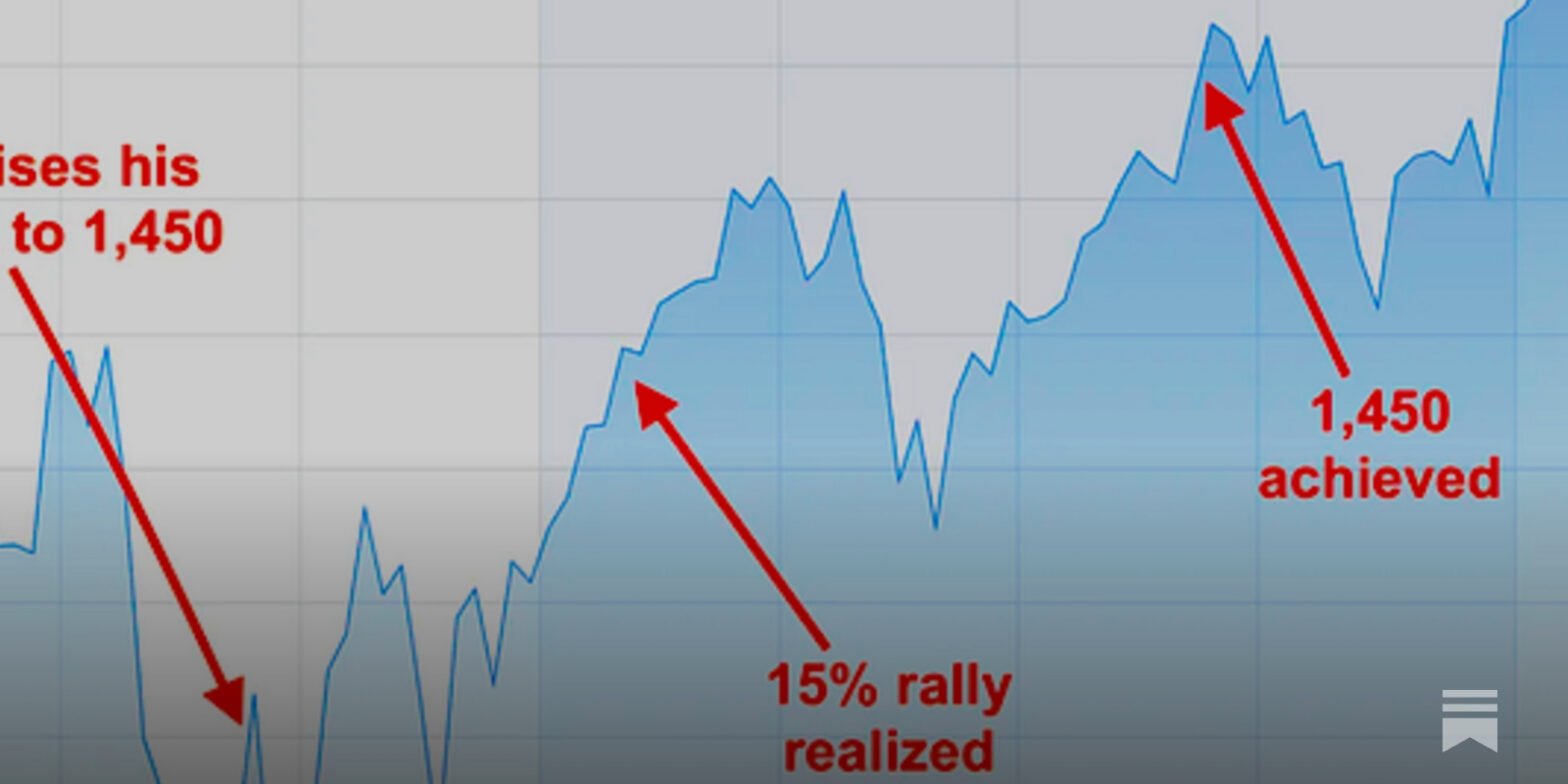
Wall Street is optimistic. Analysts estimate S&P 500 earnings will increase 15% in 2026, which would be the fastest growth in five years. But the stock market has already priced in at least some of the potential upside. The S&P 500 trades at 21.5 times forward earnings, a premium to the five-year average of 20 times forward earnings.
What does that mean for investors? S&P 500 companies will likely need to beat earnings for stocks to move materially higher this year. But if companies fail to meet Wall Street’s lofty expectations, already elevated valuations will be even more difficult to justify. That could lead to a steep decline in equity prices.
So, investors need to be cautious in the current market environment. Never buy any stock you aren’t comfortable holding through a drawdown, and consider building a larger-than-normal cash position.
Should you buy stock in S&P 500 Index right now?
Before you buy stock in S&P 500 Index, consider this:
The Motley Fool Stock Advisor analyst team just identified what they believe are the 10 best stocks for investors to buy now… and S&P 500 Index wasn’t one of them. The 10 stocks that made the cut could produce monster returns in the coming years.
Consider when Netflix made this list on December 17, 2004… if you invested $1,000 at the time of our recommendation, you’d have $415,256!* Or when Nvidia made this list on April 15, 2005… if you invested $1,000 at the time of our recommendation, you’d have $1,151,865!*
Now, it’s worth noting Stock Advisor’s total average return is 892% — a market-crushing outperformance compared to 194% for the S&P 500. Don’t miss the latest top 10 list, available with Stock Advisor, and join an investing community built by individual investors for individual investors.
*Stock Advisor returns as of February 21, 2026.
Trevor Jennewine has no position in any of the stocks mentioned. The Motley Fool has no position in any of the stocks mentioned. The Motley Fool has a disclosure policy.
The views and opinions expressed herein are the views and opinions of the author and do not necessarily reflect those of Nasdaq, Inc.