
- US Stock Benchmarks wiggle around for the 4th consecutive session as fundamentals remain quite mixed
- Tech however keeps dominating the charts and allows Nasdaq to extend to new record highs
- Exploring Technical Levels for the Dow Jones, Nasdaq and S&P 500
US stock benchmarks are wiggling around for the fourth consecutive session as the underlying macroeconomic and geopolitical fundamentals remain quite mixed but one particular Index, standing out above all.
The technology sector continues to rule the charts, aggressively pushing the Nasdaq to extend into fresh record highs while the rest of the market catches its breath.
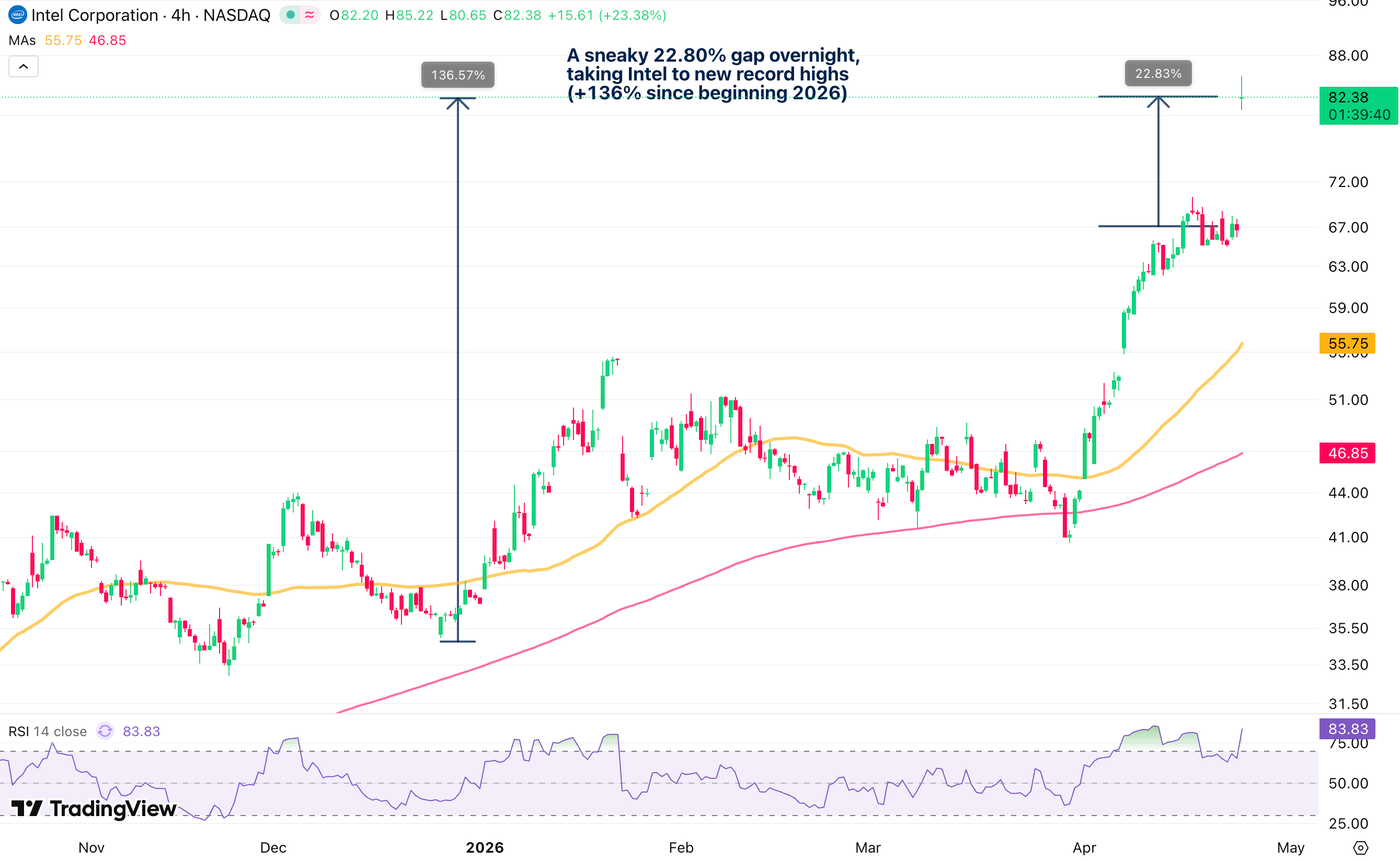
With major tech earnings officially kicking off yesterday and spanning all the way through next week, the sector is being propelled to new heights on the back of a strong trend of record reports, and yesterday’s Intel surprise kept the promise that tech nowadays is just too big to fail.
While software companies are still struggling to find their footing in this environment, electronics and semiconductors are proving to be particularly dominant.
This intense pocket of fundamental strength is single-handedly allowing the Nasdaq to heavily outperform all other global indexes.
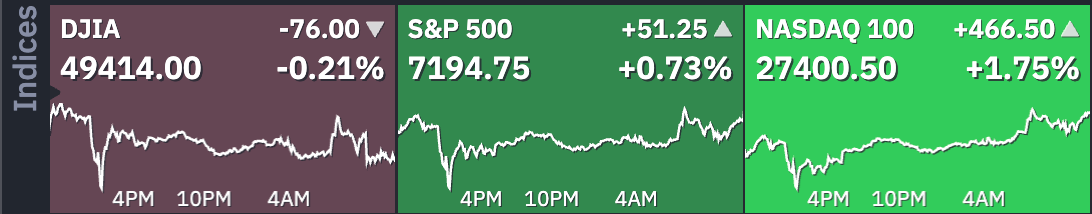
In contrast, the broader market paints a much more hesitant picture (but getting more positive as the session goes).
The Dow Jones remains quite stuck below the psychological 50,000 mark as traditional capital acts more defensively, while the S&P 500 is tentatively trying to test its own recent all-time highs without fully committing to a breakout.
The fundamental picture heading into the weekend remains extremely blurry.
High-stakes US-Iran diplomatic talks are widely expected to take place this weekend, yet no official date or time has been announced.
Adding to the tension, President Trump is maintaining heavy pressure and saying that he has time to act on Iran, implying that he doesn’t seem to be too concerned with the current infighting among Islamic regime diplomats.
Meanwhile, the aggressive US naval blockade on the Strait of Hormuz continues unabated.
This logistical stranglehold is keeping WTI Crude uncomfortably sticky above the $95 handle as traders brace for yet another high-anxiety weekend.
Let’s dive into intraday charts and trading levels for the Dow Jones Industrial Average, Nasdaq Composite, and S&P 500.
Current Session’s Stock Heatmap
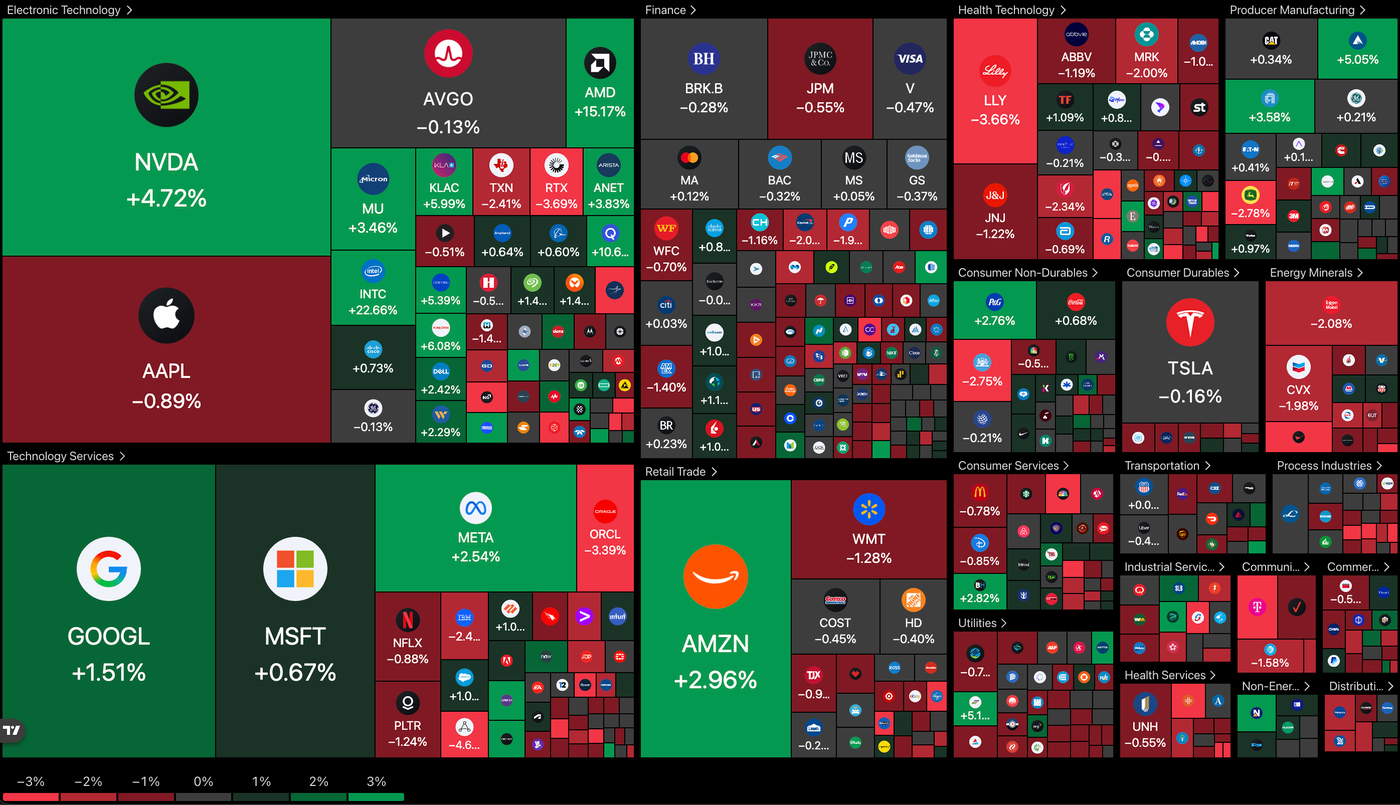
As you can see, it’s really only Tech and Semiconductors that is stealing the show while other sectors pale in comparison.
AMD (+15%) and Intel (+22%) are the largest gainers, boosting Nasdaq to +1.70% as we speak on the session. Impressive gains – Tech investors seem to have entirely forgotten the conflict already; something to be careful of in the upcoming week.
Dow Jones 4H Chart and Trading Levels
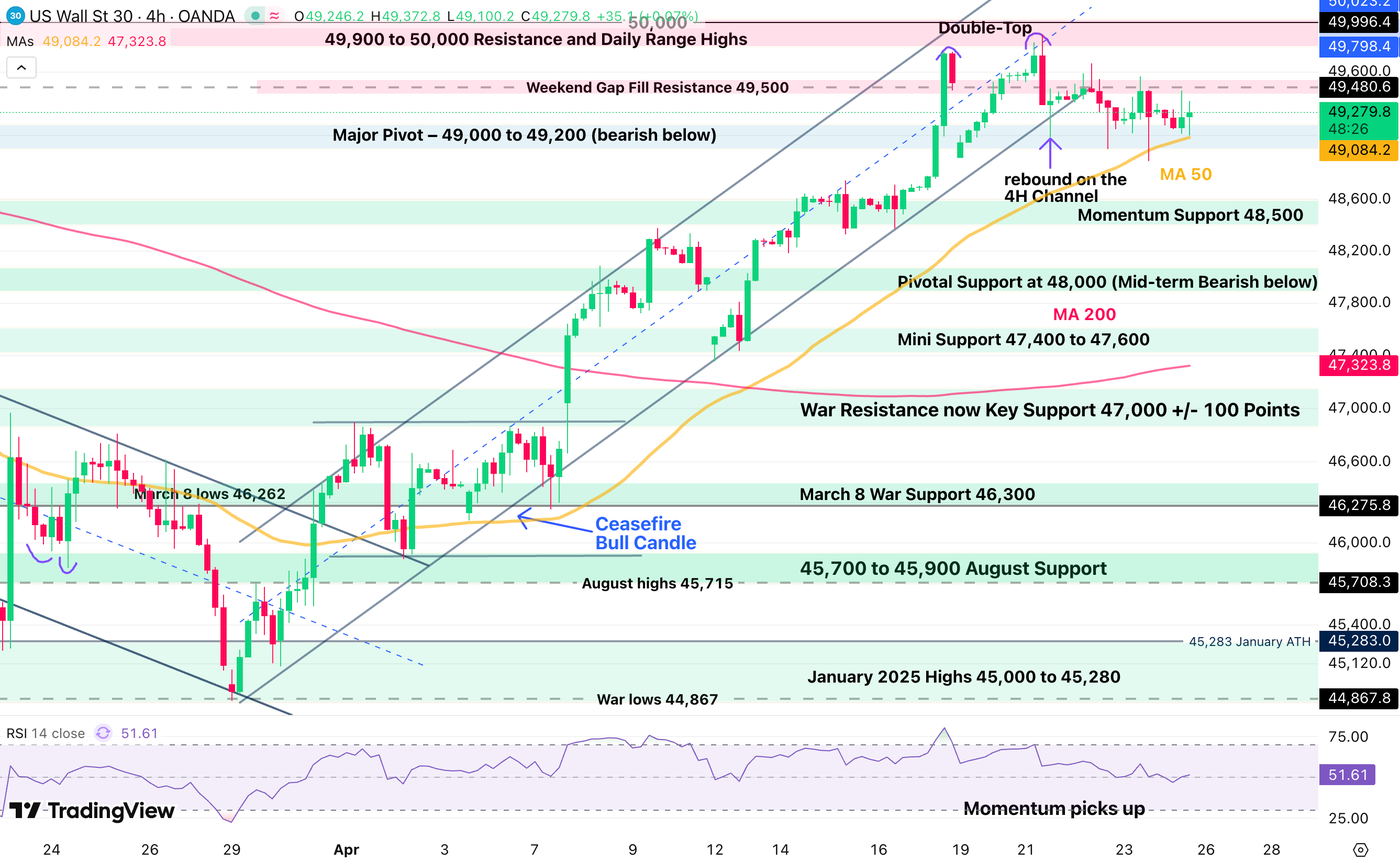
The Dow is finding some support at its 4H 50-period MA but is still looking to gather a decent buying momentum while it sees its higher beta tech-peers dancing higher.
If nothing aggravating happens next week, the DJIA could be an interesting relative strength buy in the coming week. It should also hold relatively better in the event of a large risk-off move.
- Watch out for key earnings next week, and keep 49,500 in check (bullish above).
- Breaking 49,000 brings further strength to the sellers.
Dow Jones technical levels for trading:
Resistance Levels
- Weekend Gap Fill Resistance 49,500 – 49,600
- 49,900 to 50,000 Resistance and Early 2026 Highs
- All-Time Highs 50,544
Support Levels
- 4H 50-period MA (49,080)
- Major Pivot – 49,000 to 49,200 (short-term bearish below)
- Momentum Support 48,500
- Pivotal Support at 48,000 (Mid-term Bearish below)
- Mini Support 47,400 to 47,600
Nasdaq 4H Chart and Trading Levels
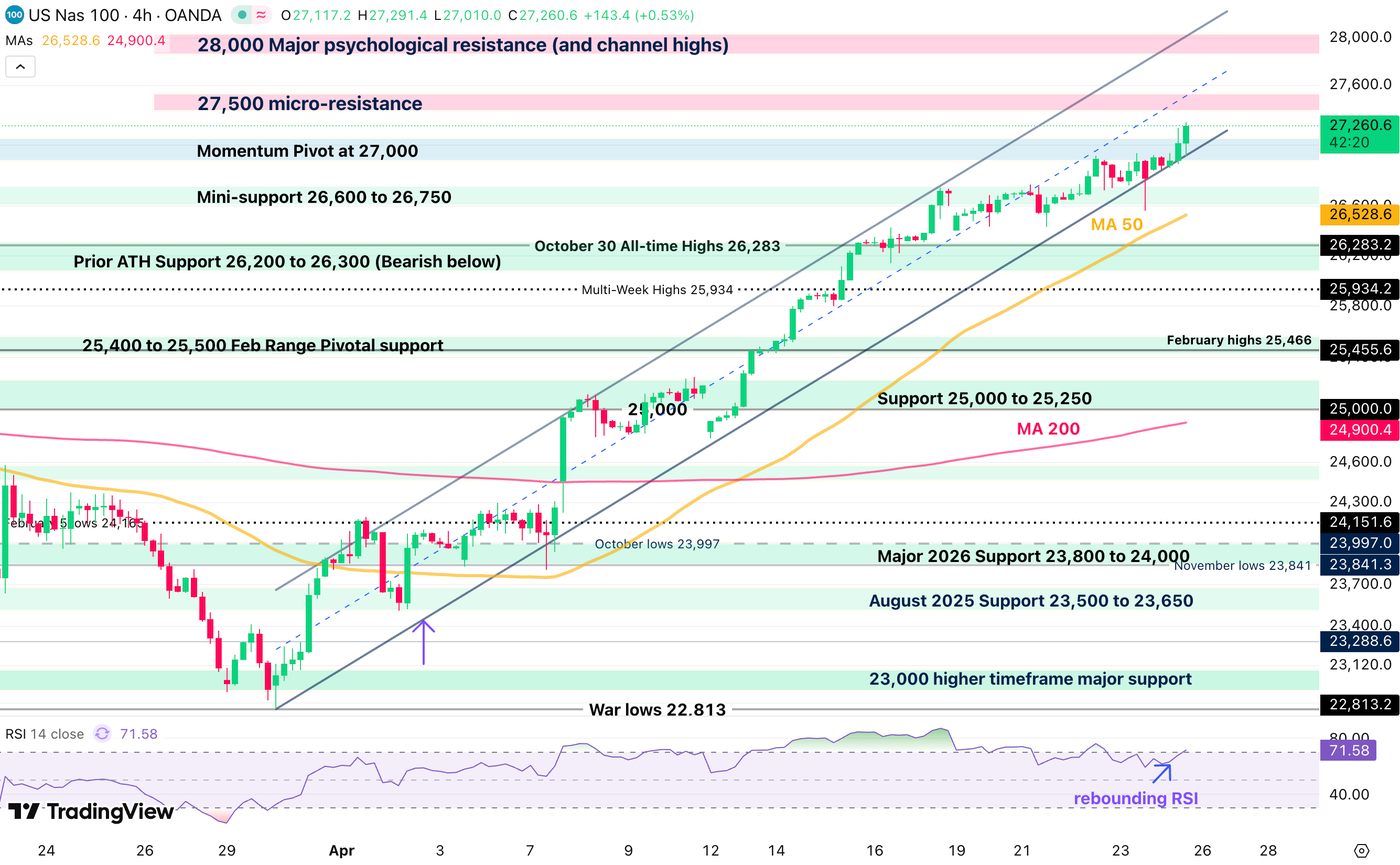
Except if anything changes fundamentally, the Nasdaq looks technically gone for another strong phase of price discovery.
Now extending well beyond its record highs, the Index is pushing towards 27,500 – Keep track of the Bull channel!
Keep close track of sentiment to make sure to not fall behind on a pursued rally or be stuck at the highs in case the action turns bearish suddenly.
Nasdaq technical levels of interest:
Resistance Levels
- Daily highs 27,300
- 27,500 micro-resistance
- 28,000 Major psychological resistance (and channel highs)
Support Levels
- Momentum Pivot at 27,000 (Short-term bearish below)
- Prior ATH Support 26,200 to 26,300
- 25,400 to 25,500 Feb Range Intraday Support
- War Support 25,000 to 25,250
- 24,450 to 24,550 Key Support
- Early 2025 ATH at 22,000 to 22,229 Support
S&P 500 4H Chart and Trading Levels
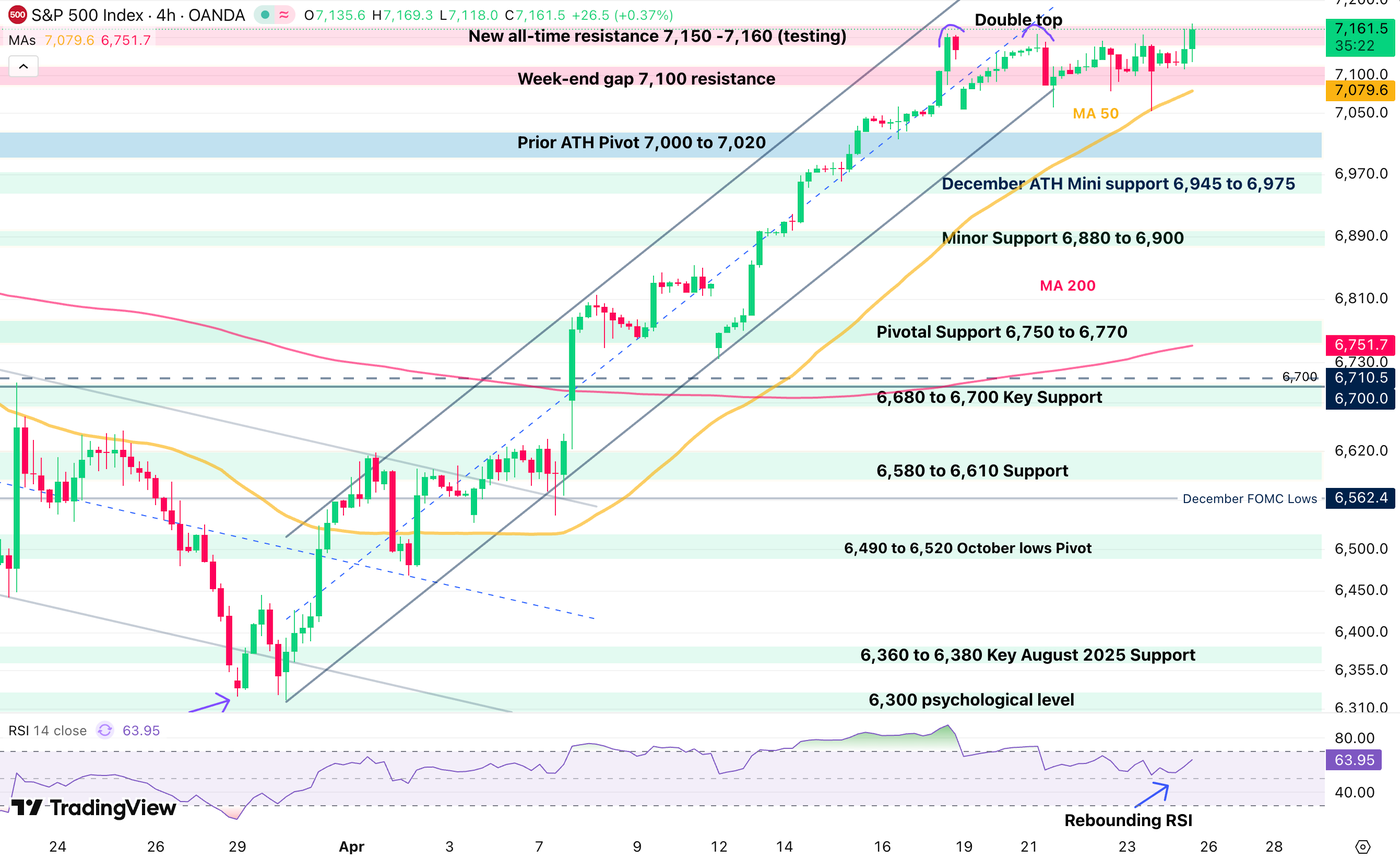
Stuck in a consolidation near its all-time highs since the beginning of the week, the S&P 500 is pushing for a record break as we speak.
If the tone doesn’t sour heading into the weekend, the Index should easily extend 20-40 points extra into the first few days of next week.
Watch the 50-period MA (7,080) in case the action brutally reverses (short-term bearish below).
S&P 500 technical levels of interest:
Resistance Levels
- Daily highs 7,167
- New all-time resistance 7,150 – 7,160
- Next key potential resistance 7,200
Support Levels
- 7,100 psychological level
- Prior ATH Pivot 7,000 to 7,020
- Minor Support 6,880 to 6,900
- Pivotal Support 6,750 to 6,770
- 6,300 psychological level (War lows)
Keep track of WTI Crude and the latest headlines throughout the week to stay ahead of the curve, with investors still confused about US-Iran negotiations.
Safe Trades!
Follow Elior on Twitter/X for Additional Market News, interactions and Insights @EliorManier
Opinions are the authors’; not necessarily that of OANDA Business Information & Services, Inc. or any of its affiliates, subsidiaries, officers or directors. The provided publication is for informational and educational purposes only.
If you would like to reproduce or redistribute any of the content found on MarketPulse, an award winning forex, commodities and global indices analysis and news site service produced by OANDA Business Information & Services, Inc., please refer to the MarketPulse Terms of Use.
Visit https://www.marketpulse.com/ to find out more about the beat of the global markets.
© 2026 OANDA Business Information & Services Inc.
About the Author

Elior Manier
Market Analyst
Elior brings over seven years of experience in financial markets to our analyst team. Since 2018, he has actively engaged in observing, charting, and trading, driven by his passion for mastering market dynamics. With a profound understanding of the geopolitical and macroeconomic forces that shape market movements, Elior focuses on analysing the impact of breaking news, market sentiment, and critical economic data releases on trading flows.
As a versatile analyst, he contributes powerful insights to the team, effectively integrating geopolitical and technical analysis to provide clear and comprehensive market perspectives.
Prior to joining our team, Elior honed his expertise as a Fixed Income Trader and Market Analyst at the Montreal Exchange.