Nothing lasts forever.
This is especially true in the business world: Entrepreneurs and executives come and go, and industries and companies rise and fall.
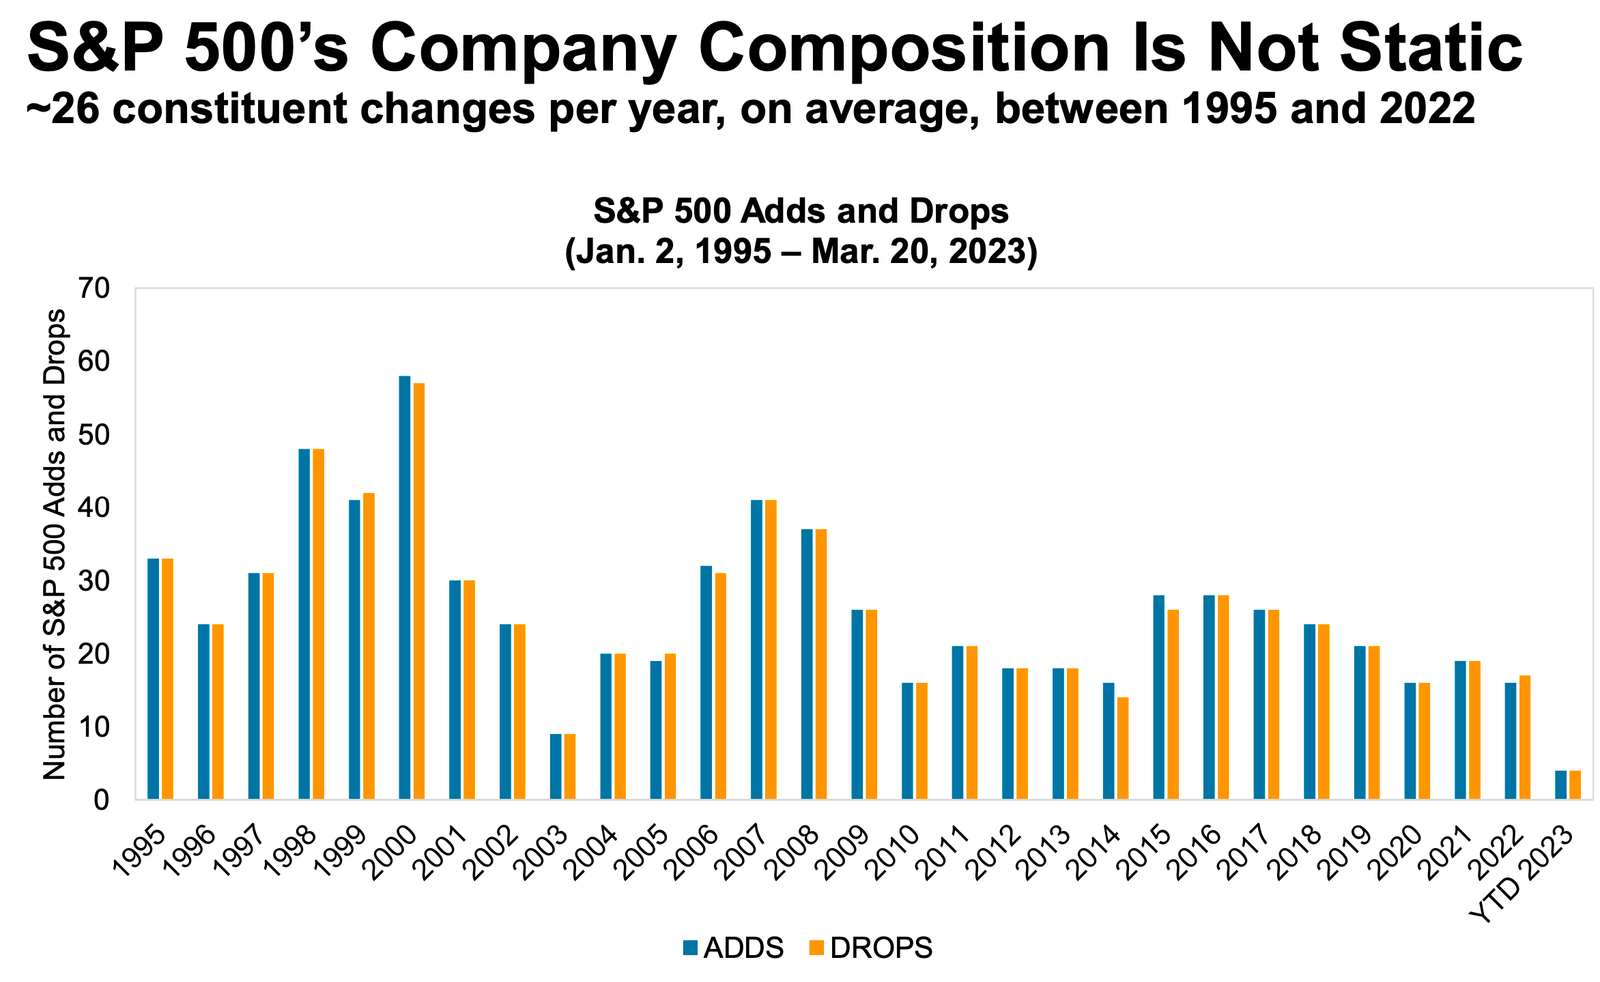
These dynamics are very much at the core of TKer Stock Market Truth No. 9: There’s a lot of turnover in the stock market. Specifically, this observation concerns how stocks are regularly added to and removed from the market and the major indices.
But philosophically, Truth No. 9 also speaks to the many changes that long-lasting businesses experience during their time as going concerns.
Last Monday, Apple announced that Tim Cook, its CEO for 15 years, would step down from the top job in September.
This is a big deal as Cook oversaw many of the company’s wins, creating trillions of dollars of shareholder value. From the announcement:
He became CEO in 2011 and has overseen the introduction of numerous products and services, including new categories like Apple Watch, AirPods, and Apple Vision Pro, and services ranging from iCloud and Apple Pay to Apple TV and Apple Music. He was also instrumental in expanding existing product lines. Under Cook’s leadership Apple has grown from a market capitalization of approximately $350 billion to $4 trillion, representing a more than 1,000% increase, and yearly revenue has nearly quadrupled, from $108 billion in fiscal year 2011 to more than $416 billion in fiscal year 2025.
His departure surely has some investors concerned. Indeed, Apple shares fell 2.5% on the first trading day following the announcement, underperforming the market.
While leadership changes don’t always go as hoped, history also shows they can work out well. In fact, Apple is arguably the epitome of what shareholders hope for.
Cook had incredibly big shoes to fill in 2011 when he stepped in for visionary leader Steve Jobs. And he delivered.

“The fact of the matter is nobody is irreplaceable,” Berkshire Hathaway’s Ajit Jain said at his company’s 2024 shareholder meeting. “We have Tim Cook here in the audience who has proved that.”
Jain, who oversees Berkshire’s massive insurance operations, made his haunting observation after his boss Warren Buffett quipped, “We won’t find another Ajit.“
Buffett himself made his comment after the then-recent passing of Berkshire executive Charlie Munger, who had been at the company for over 40 years. Buffett, 95, handed the Berkshire CEO reins to a successor earlier this year.
No one leads a business forever.
Earlier this month, the once-popular, now-flailing shoe brand Allbirds announced a major pivot to its business model.
From the announcement:
In connection with this pivot, the Company anticipates changing its name to “NewBird AI.” … NewBird AI’s long-term vision is to become a fully integrated GPU-as-a-Service (GPUaaS) and AI-native cloud solutions provider. Over time, the Company intends to grow its neocloud platform by expanding its compute and service offerings, deepening partnerships with operators and customers, and evaluating strategic M&A opportunities.
People were quick to remember when the alcoholic beverage maker Long Island Iced Tea Corp pivoted to blockchain and changed its name to Long Blockchain Corp. Some noted the time AMC Theatres bought a stake in a gold and silver miner.
All this is to say, people — including me — have their doubts. It’s one thing to pivot to an adjacent business. It’s another thing to dive headfirst into an unrelated business that just happens to be hot right now.
That said, it’s not crazy for companies to make big changes to how they make money. Sometimes it happens gradually — think of Netflix becoming a streaming platform after starting as a DVD rental-by-mail business. Sometimes it happens through acquisitions — think of Berkshire Hathaway, which started as a textile company but bought its way into the insurance business.
There are a lot of prominent companies today in businesses that their founders probably couldn’t have imagined.
-
Nokia, the Finnish telecommunications company, got its start in 1865 as a paper pulp factory.
-
Nintendo, the ubiquitous Japanese video game company, originally sold playing cards in 1889.
-
Raytheon, the American defense company, was in the refrigeration business in 1922 long before it sold Tomahawk cruise missiles and Patriot missile defense systems.
-
Samsung was exporting dried fish and produce in 1938 before getting into the electronics it’s known for today.

The original Samsung headquarters. (Source: Wikipedia) -
DuPont, the 200-year-old chemical giant, had gunpowder as its first product.
-
American Express was delivering packages in 1850 before it got into credit cards.
-
Bayer, the German pharmaceutical giant, was originally in the production of dyes in 1881 before it started selling Aspirin. (If you dig a little deeper, you’ll find bottles of Heroin with the Bayer logo on it.)
-
William Wrigley Jr. didn’t originally sell gum in 1891. He gave it away for free to customers who bought his soap.

To be clear, companies don’t have to exit their early businesses to survive and grow shareholder value. Alphabet (formerly Google) still offers search; Apple still sells personal computers; Microsoft still sells operating systems; Amazon still sells books online; and Meta (formerly Facebook) still operates its original social network. But all these companies got into many other massive businesses before they became trillion-dollar corporate behemoths.
At the end of the day, publicly traded companies aren’t out here to sell a product. They’re out here to allocate capital, make money, and increase shareholder value. Sometimes, this means shifting focus away from the original product the company was known for.
Leadership transitions and business pivots don’t always work out.
But the companies that pull it off sometimes go on to become the largest and most successful enterprises in the world.
And it’s often the case that turnover in the stock market and the major market indices can be explained by whether or not a company was able to execute these transitions successfully.
All of this makes investing in the stock market complicated and interesting. Who knows what businesses and which business leaders will be responsible for driving the market higher in the years to come?
–
Related from TKer:
-
Ajit Jain’s haunting observation about impermanence in business 🤔
-
Sometimes, the best business decision is to change businesses 💔
-
Berkshire’s new CEO makes clear what this business is really about 🎯
📈The stock market rallied to all-time highs, with the S&P 500 setting an intraday high of 7,168.59 and a closing high of 7,165.08 on Friday. The index is now up 4.7% year-to-date. For market insights, check out the Stock Market tab at TKer. »
There were several notable data points and macroeconomic developments since our last review:
👎 Consumer vibes are in the dumps. From the University of Michigan’s April Surveys of Consumers: “Consumer sentiment ticked down 3.5 index points this month, now comparable to the trough seen in June 2022. Decreases in sentiment were seen across political party, income, age, and education. Expected business conditions declined for both short and long time horizons, nearly matching year-ago readings when the reciprocal tariff regime was implemented. After the two-week cease-fire was announced and gas prices softened a touch, sentiment recovered a modest portion of its early-month losses. The Iran conflict appears to influence consumer views primarily through shocks to gasoline and potentially other prices. In contrast, military and diplomatic developments that do not lift supply constraints or lower energy prices are unlikely to buoy consumers.”
For more on consumer sentiment, read: What consumers do > what consumers say 🙊
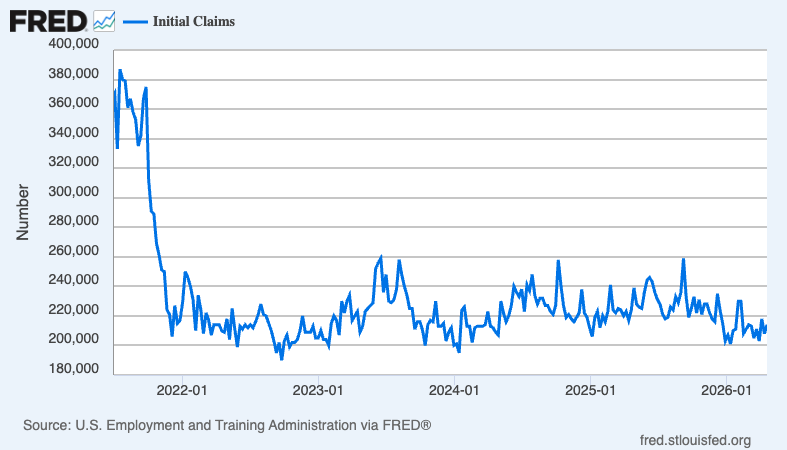
💼 New unemployment insurance claims, total ongoing claims remain low. Initial claims for unemployment benefits rose to 214,000 during the week ending Apr. 18, up from 208,000 the week prior. This metric remains at levels historically associated with economic growth.
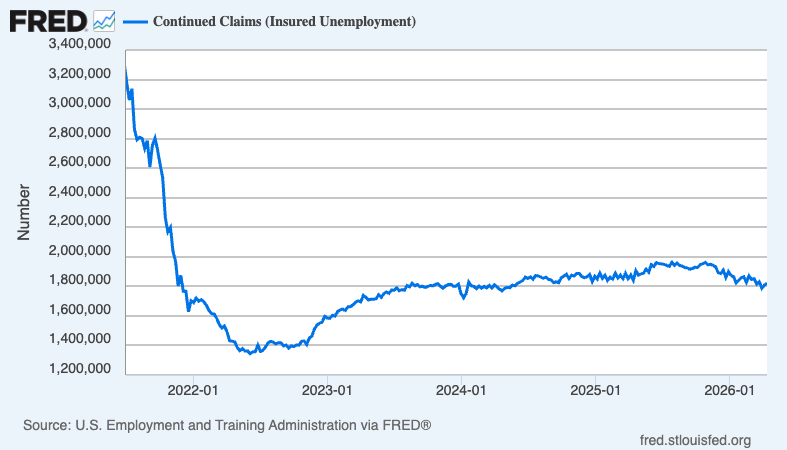
Insured unemployment, which captures those who continue to claim unemployment benefits, ticked up to 1.821 million during the week ending Apr. 11.
For more on the labor market, read: The next couple of years for the job market could be tough 🫤
🤔 Recent private job growth has picked up. According to payroll processor ADP, private U.S. employers added 54,750 jobs in the four weeks ending April 4.
For more on the labor market, read: About that ugly jobs report 📉
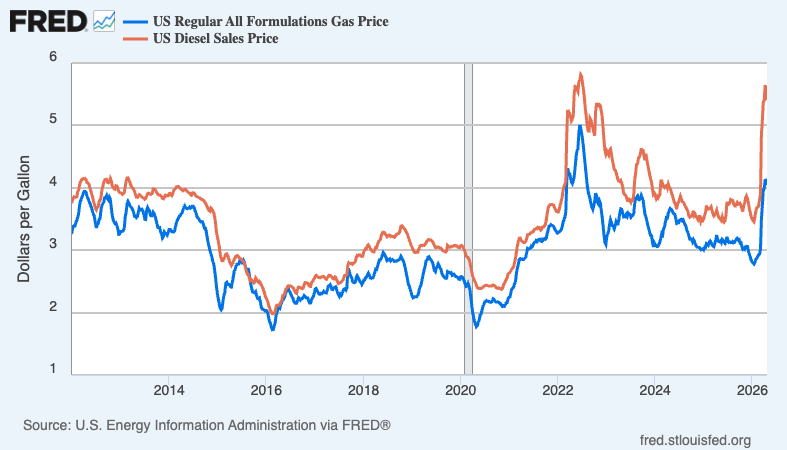
⛽️ Gas and diesel prices remain elevated. From AAA: “Drivers are getting a bit of relief at the pump as the national average went down by 6 cents since last week to $4.03. Crude oil prices have come down below $100/barrel, helping drive down the cost of gasoline for consumers. But how long the downward trend will last is uncertain with continued instability along the Strait of Hormuz. Currently, pump prices are the highest they’ve been during this time of year since 2022, when the national average on April 23 was $4.11.“
Here’s a look at the trajectory of gas and diesel prices, as tracked by the EIA.
For more on energy prices, read: Our love-hate relationship with rising oil prices in charts 💔🛢️📊
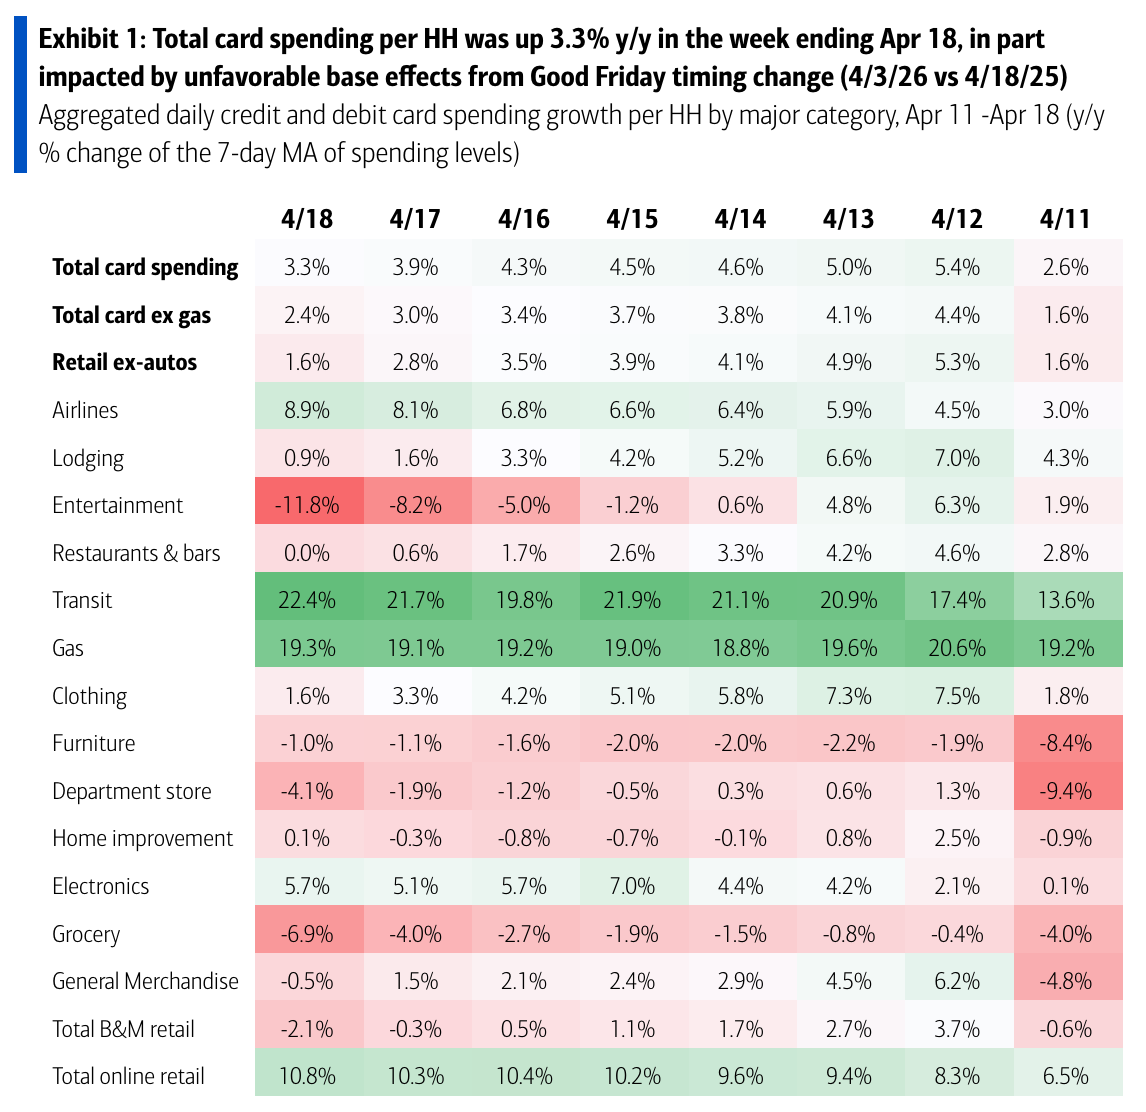
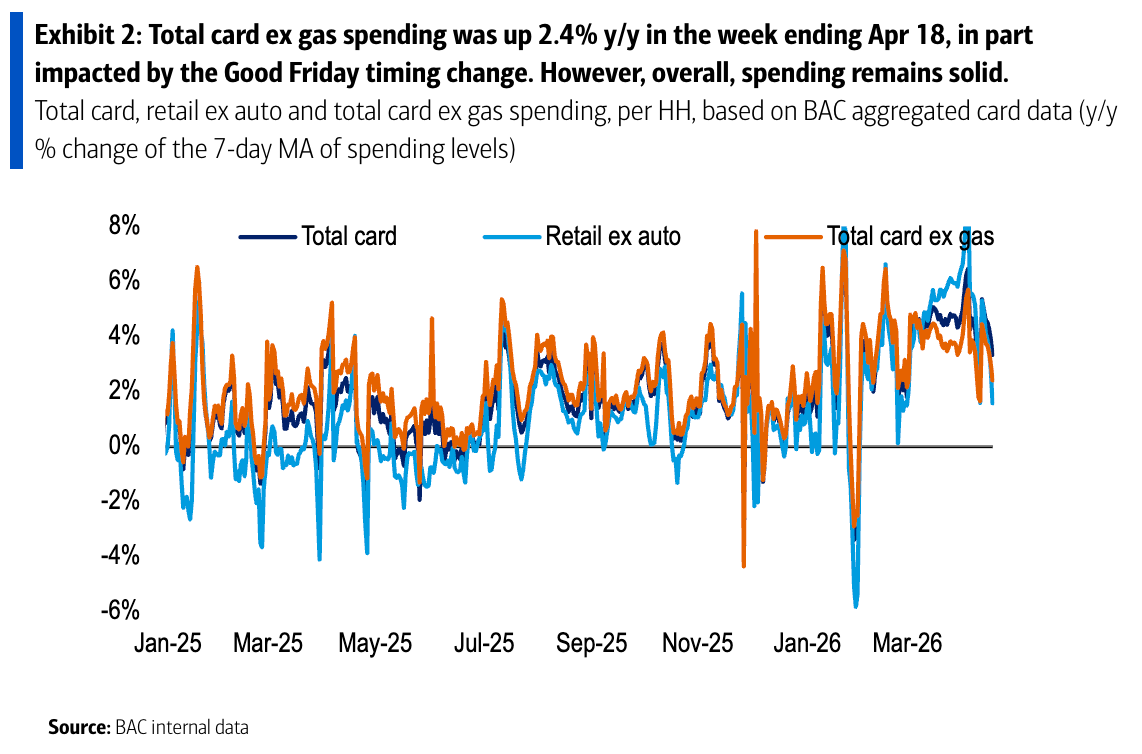
💳 Card spending data is holding up. From BofA: “Total card spending per HH was up 3.3% y/y in the week ending Apr 18, according to BAC aggregated credit & debit card data. Total ex gas spending was up 2.4% y/y, in part impacted by unfavorable base effects from Good Friday timing change. Overall, spending remains solid. Y/y entertainment spending declined the most while transit grew the most since last week.“
Consumer spending data has looked a lot better than consumer sentiment readings. For more on this contradiction, read: We’re taking that vacation whether we like it or not 🛫 and Household finances are both ‘worse’ and ‘good’ 🌦️
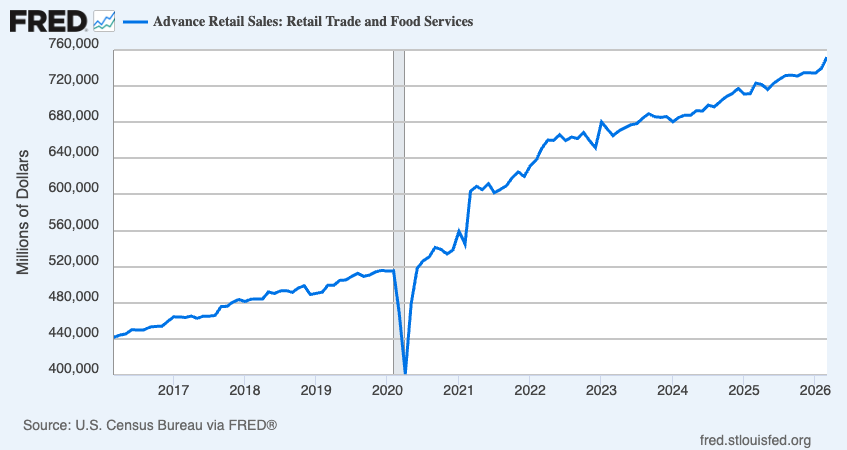
🛍️ Retail shopping activity rose. Retail sales in March jumped 1.7% to a record $752.1 billion, fueled by higher gasoline prices.
Excluding autos and gas, which tend to be volatile over the short-term, retail sales climbed 0.6%.
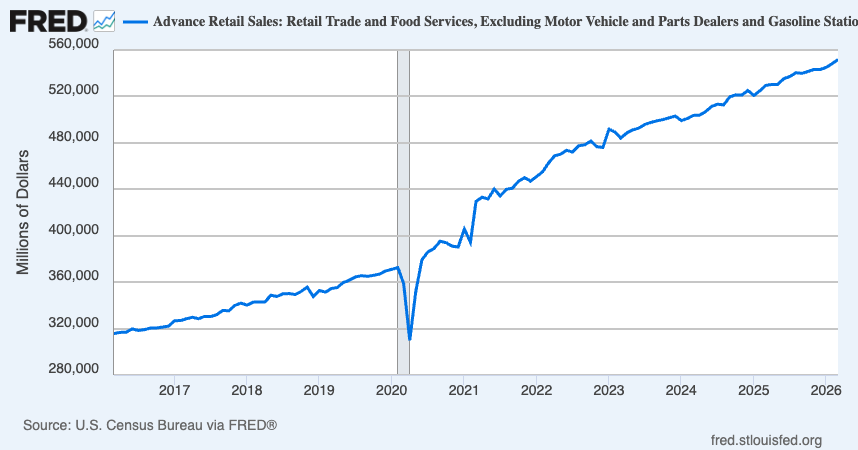
Most retail categories grew.
🏠 Mortgage rates dip. According to Freddie Mac, the average 30-year fixed-rate mortgage declined to 6.23%, down from 6.30% last week. “This improvement, coupled with a pickup in purchase applications and refinance activity, as well as an increase in monthly pending home sales, underscores signs of improving momentum in the market.“
As of Q4, there were 148.7 million housing units in the U.S., of which 87.8 million were owner-occupied and about 40% were mortgage-free. Of those carrying mortgage debt, almost all have fixed-rate mortgages, and most of those mortgages have rates that were locked in before rates surged from 2021 lows. All of this is to say: Most homeowners are not particularly sensitive to the small weekly movements in home prices or mortgage rates.
For more on mortgages and home prices, read: Why home prices and rents are creating all sorts of confusion about inflation 😖
👍 Economic activity survey improves. From S&P Global’s April U.S. Flash PMI: “A rebound in business output growth in April is good news after the near-stagnation seen in March, but over the past three months we have seen the weakest expansion of output recorded since the start of 2024 with the war in the Middle East squarely to blame. The April PMI is broadly consistent with the economy struggling to manage annualized growth in excess of 1%, with the vast service sector acting as the principal drag. Orders for services ranging from travel and tourism to financial products barely rose as the war caused hesitancy for spending among both household and business customers, with surging prices and the prospect of higher borrowing costs acting as a further deterrent.“
Keep in mind that during times of perceived stress, soft survey data tends to be more exaggerated than actual hard data.
For more on this, read: What businesses do > what businesses say 🙊 and 4 sometimes-conflicting ways I’m thinking about the economy 😬😞😎🙃
📈 Near-term GDP growth estimates are tracking positively. The Atlanta Fed’s GDPNow model sees real GDP growth rising at a 1.2% rate in Q1.
For more on GDP and the economy, read: It’s too ambiguous to just say ‘the economy’ 🤦🏻♂️ and Economic data can often be both ‘worse’ and ‘good’ 🌦️
Earnings look bullish: The long-term outlook for the stock market remains favorable, bolstered by expectations for years of earnings growth. And earnings are the most important driver of stock prices.
Demand is positive: Demand for goods and services remains positive, supported by healthy consumer and business balance sheets. Personal spending activity remains at record levels. Core capex orders, which are a leading indicator of business spending, have been on the rise.
Growth is cooling: While the economy remains healthy, growth has normalized from much hotter levels earlier in the cycle. The economy is less “coiled” these days as major tailwinds like job openings and excess savings have faded. Job creation is hovering at near-zero. It has become harder to argue that growth is destiny.
Actions speak louder than words: We are in an odd period, given that the hard economic data decoupled from the soft sentiment-oriented data. Consumer and business sentiment has been relatively poor, even as tangible consumer and business activity continues to grow and trend at record levels. From an investor’s perspective, what matters is that the hard economic data continues to hold up.
Stocks are not the economy: There’s a case to be made that the U.S. stock market could outperform the U.S. economy in the near term, thanks largely to positive operating leverage. Since the pandemic, companies have aggressively adjusted their cost structures. This came with strategic layoffs and investment in new equipment, including hardware powered by AI. These moves are resulting in positive operating leverage, which means a modest amount of sales growth — in the cooling economy — is translating to robust earnings growth.
Mind the ever-present risks: Of course, we should not get complacent. There will always be risks to worry about, such as U.S. political uncertainty, geopolitical turmoil, energy price volatility, and cyber attacks. There are also the dreaded unknowns. Any of these risks can flare up and spark short-term volatility in the markets.
Investing is never a smooth ride: There’s also the harsh reality that economic recessions and bear markets are developments that all long-term investors should expect as they build wealth in the markets. Always keep your stock market seat belts fastened.
Think long-term: For now, there’s no reason to believe there’ll be a challenge that the economy and the markets won’t overcome. The long game remains undefeated, and it’s a streak that long-term investors can expect to continue.
For more on how the macro story is evolving, check out the previous review of the macro crosscurrents. »
Here’s a roundup of some of TKer’s most talked-about paid and free newsletters about the stock market. All of the headlines are hyperlinked to the archived pieces.
The stock market can be an intimidating place: It’s real money on the line, there’s an overwhelming amount of information, and people have lost fortunes in it very quickly. But it’s also a place where thoughtful investors have long accumulated a lot of wealth. The primary difference between those two outlooks is related to misconceptions about the stock market that can lead people to make poor investment decisions.
Passive investing is a concept usually associated with buying and holding a fund that tracks an index. And no passive investment strategy has attracted as much attention as buying an S&P 500 index fund. However, the S&P 500 — an index of 500 of the largest U.S. companies — is anything but a static set of 500 stocks.
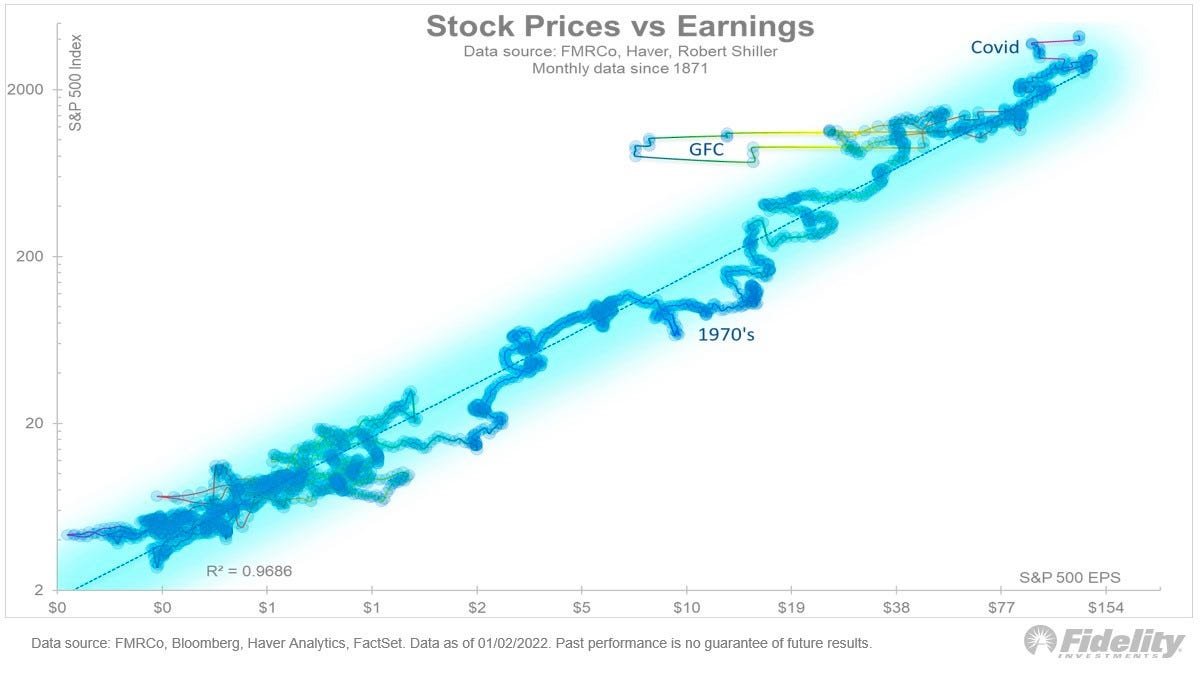
For investors, anything you can ever learn about a company matters only if it also tells you something about earnings. That’s because long-term moves in a stock can ultimately be explained by the underlying company’s earnings, expectations for earnings, and uncertainty about those expectations for earnings. Over time, the relationship between stock prices and earnings has a very tight statistical relationship.
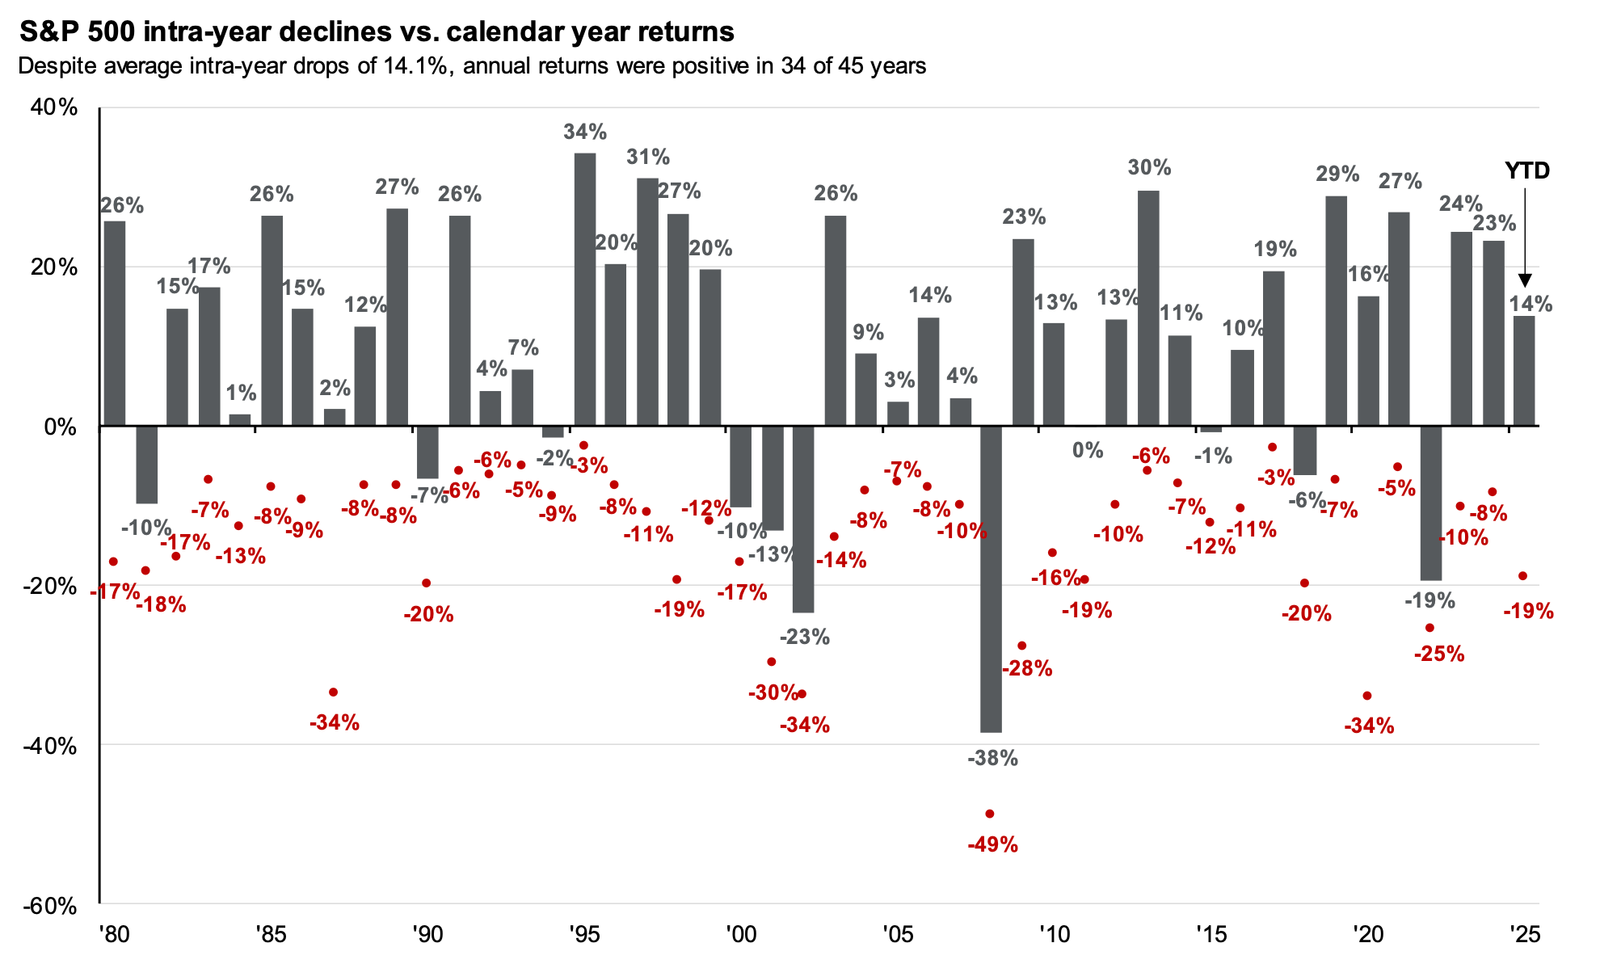
Investors should always be mentally prepared for some big sell-offs in the stock market. It’s part of the deal when you invest in an asset class that is sensitive to the constant flow of good and bad news. Since 1950, the S&P 500 has seen an average annual max drawdown (i.e., the biggest intra-year sell-off) of 14%.
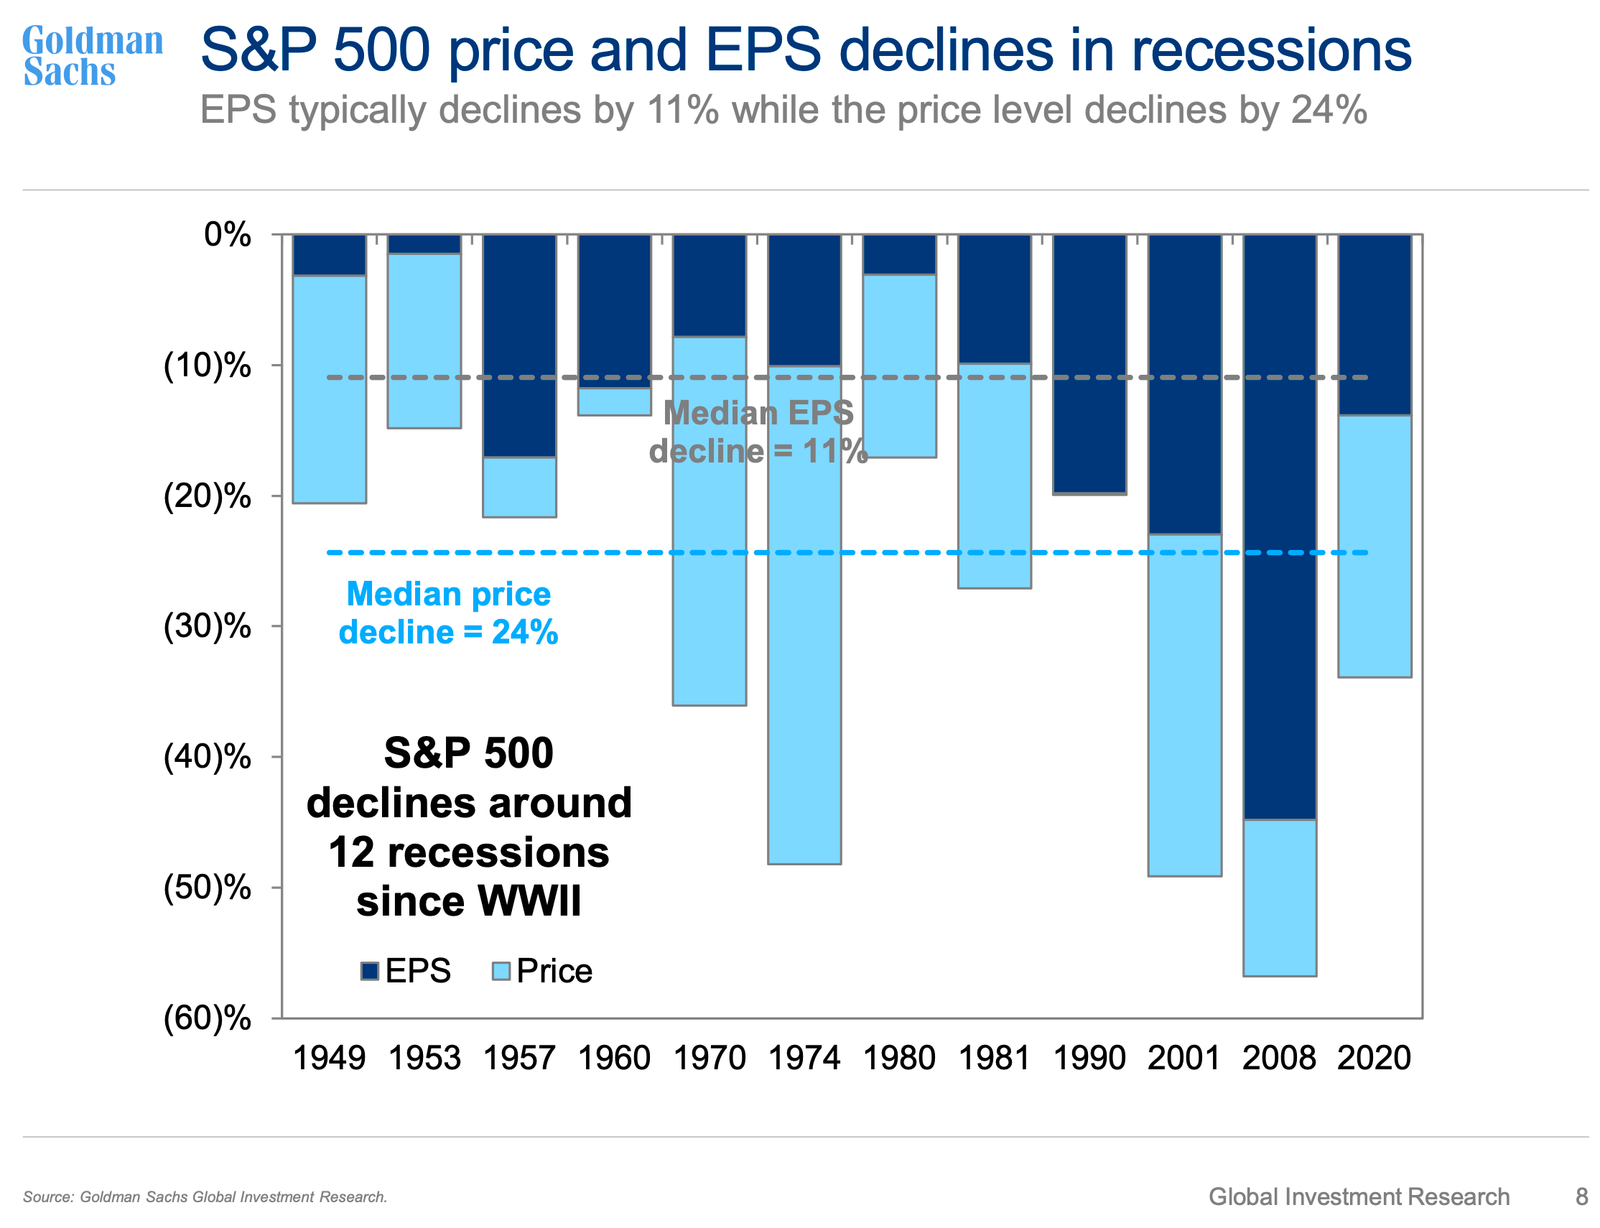
Every recession in history was different. And the range of stock performance around them varied greatly. There are two things worth noting. First, recessions have always been accompanied by a significant drawdown in stock prices. Second, the stock market bottomed and inflected upward long before recessions ended.
Since 1928, the S&P 500 has generated a positive total return more than 89% of the time over all five-year periods. Those are pretty good odds. When you extend the timeframe to 20 years, you’ll see that there’s never been a period where the S&P 500 didn’t generate a positive return.
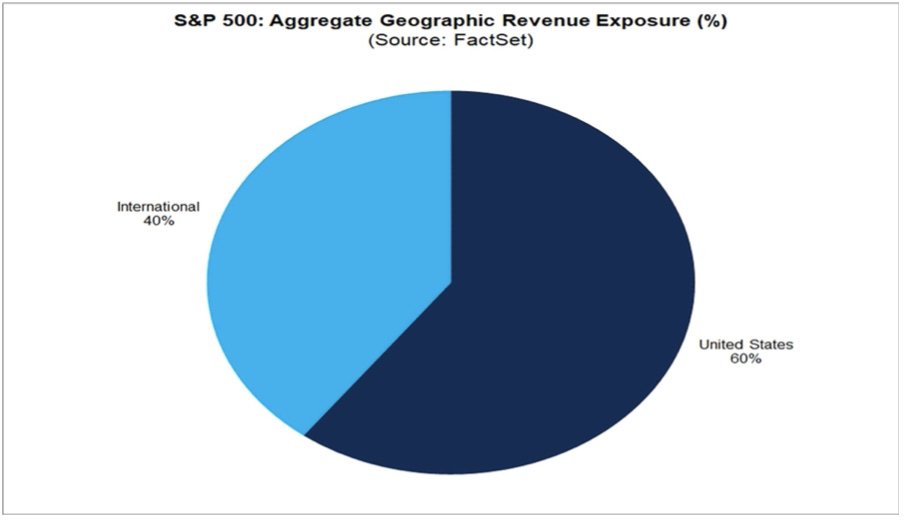
While a strong dollar may be great news for Americans vacationing abroad and U.S. businesses importing goods from overseas, it’s a headwind for multinational U.S.-based corporations doing business in non-U.S. markets.
…you don’t want to buy them when earnings are great, because what are they doing when their earnings are great? They go out and expand capacity. Three or four years later, there’s overcapacity and they’re losing money. What about when they’re losing money? Well, then they’ve stopped building capacity. So three or four years later, capacity will have shrunk and their profit margins will be way up. So, you always have to sort of imagine the world the way it’s going to be in 18 to 24 months as opposed to now. If you buy it now, you’re buying into every single fad every single moment. Whereas if you envision the future, you’re trying to imagine how that might be reflected differently in security prices.
Some event will come out of left field, and the market will go down, or the market will go up. Volatility will occur. Markets will continue to have these ups and downs. … Basic corporate profits have grown about 8% a year historically. So, corporate profits double about every nine years. The stock market ought to double about every nine years… The next 500 points, the next 600 points — I don’t know which way they’ll go… They’ll double again in eight or nine years after that. Because profits go up 8% a year, and stocks will follow. That’s all there is to it.
Long ago, Sir Isaac Newton gave us three laws of motion, which were the work of genius. But Sir Isaac’s talents didn’t extend to investing: He lost a bundle in the South Sea Bubble, explaining later, “I can calculate the movement of the stars, but not the madness of men.” If he had not been traumatized by this loss, Sir Isaac might well have gone on to discover the Fourth Law of Motion: For investors as a whole, returns decrease as motion increases.
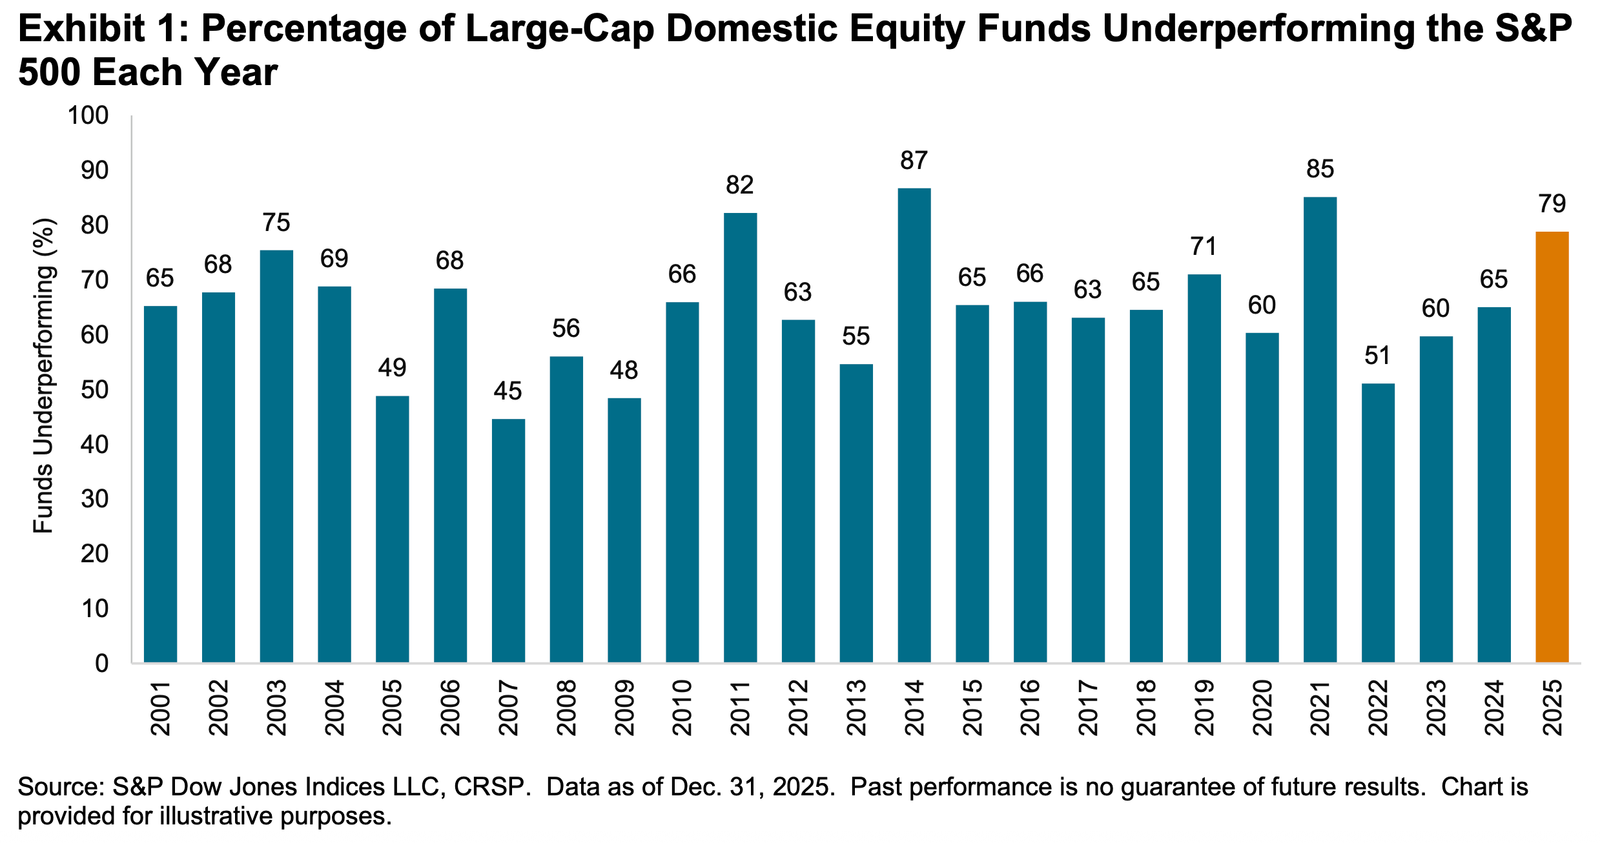
According to S&P Dow Jones Indices (SPDJI), 79% of U.S. large-cap equity fund managers underperformed the S&P 500 in 2025. As you stretch the time horizon, the numbers get even more dismal. Over three years, 67% underperformed. Over 5 years, 89% underperformed. And over 20 years, 93% underperformed. This 2025 performance was the 16th consecutive year in which the majority of fund managers in this category have lagged the index.
Even if you are a fund manager who generated industry-leading returns in one year, history says it’s an almost insurmountable task to stay on top consistently in subsequent years. According to S&P Dow Jones Indices, just 4.21% of all U.S. equity funds in the top half of performance during the first year were able to remain in the top during the four subsequent years. Only 2.42% of U.S. large-cap funds remained in the top half
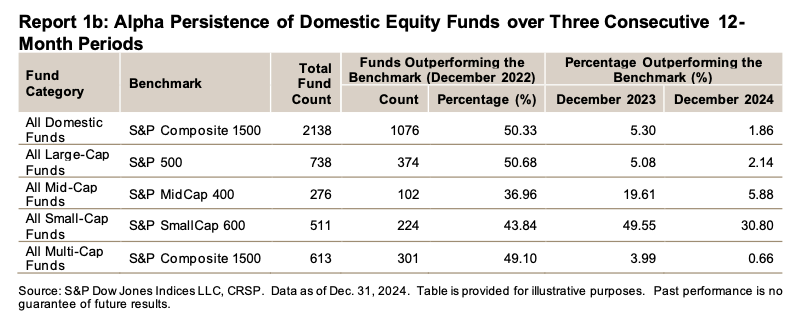
SPDJI’s report also considered fund performance relative to their benchmarks over the past three years. Of 738 U.S. large-cap equity funds tracked by SPDJI, 50.68% beat the S&P 500 in 2022. Just 5.08% beat the S&P in the two years ending 2023. And only 2.14% of the funds beat the index over the three years ending in 2024.
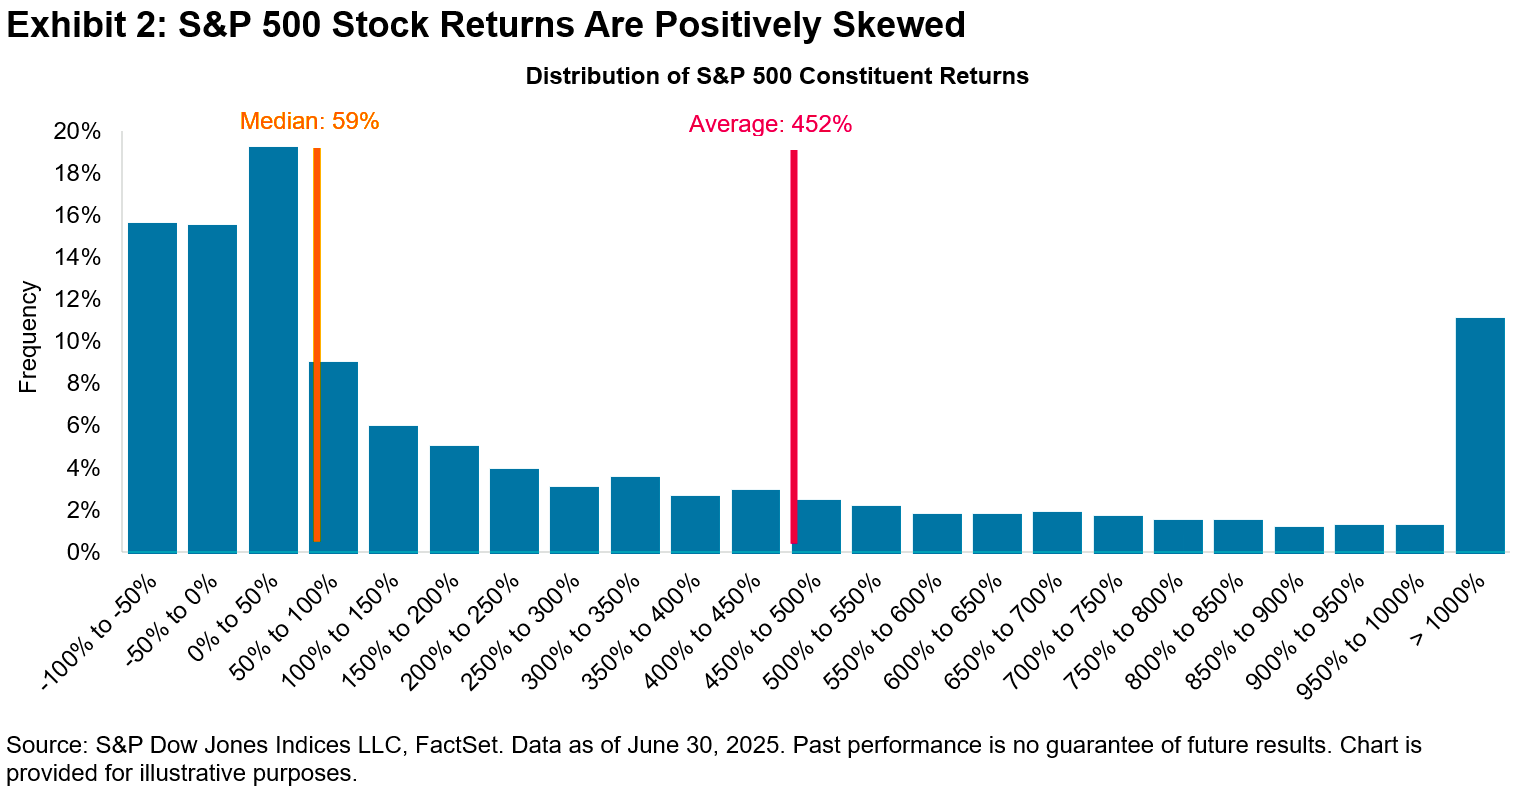
Picking stocks in an attempt to beat market averages is an incredibly challenging and sometimes money-losing effort. Most professional stock pickers aren’t able to do this consistently. One of the reasons for this is that most stocks don’t deliver above-average returns. According to S&P Dow Jones Indices, only 19% of the stocks in the S&P 500 outperformed the average stock’s return from 2001 to 2025. Over this period, the average return on an S&P 500 stock was 452%, while the median stock rose by just 59%.