
In the current climate of uncertainty in the Middle East, particularly with tensions surrounding Iran affecting regional markets, investors are keenly observing how these dynamics influence stock performance across Gulf bourses. Amidst this backdrop, dividend stocks like those from Emirates Insurance Company P.J.S.C. offer potential stability and income generation, making them an attractive consideration for those navigating volatile markets.
Top 10 Dividend Stocks In The Middle East
| Name | Dividend Yield | Dividend Rating |
| Turkiye Garanti Bankasi (IBSE:GARAN) | 3.38% | ★★★★★☆ |
| Saudi National Bank (SASE:1180) | 5.97% | ★★★★★☆ |
| National General Insurance (P.J.S.C.) (DFM:NGI) | 7.72% | ★★★★★☆ |
| Matrix IT (TASE:MTRX) | 4.07% | ★★★★★☆ |
| Emirates Insurance Company P.J.S.C (ADX:EIC) | 7.89% | ★★★★★★ |
| Emaar Properties PJSC (DFM:EMAAR) | 8.58% | ★★★★★☆ |
| Computer Direct Group (TASE:CMDR) | 5.82% | ★★★★★☆ |
| Arab National Bank (SASE:1080) | 6.16% | ★★★★★☆ |
| Anadolu Hayat Emeklilik Anonim Sirketi (IBSE:ANHYT) | 7.37% | ★★★★★☆ |
| Akbank T.A.S (IBSE:AKBNK) | 3.13% | ★★★★★☆ |
Click here to see the full list of 60 stocks from our Top Middle Eastern Dividend Stocks screener.
Here we highlight a subset of our preferred stocks from the screener.
Emirates Insurance Company P.J.S.C (ADX:EIC)
Simply Wall St Dividend Rating: ★★★★★★
Overview: Emirates Insurance Company P.J.S.C. operates in the general insurance and reinsurance sectors across the United Arab Emirates, the United States, and Europe, with a market cap of AED1.14 billion.
Operations: Emirates Insurance Company P.J.S.C. generates its revenue through its operations in the general insurance and reinsurance sectors across multiple regions, including the United Arab Emirates, the United States, and Europe.
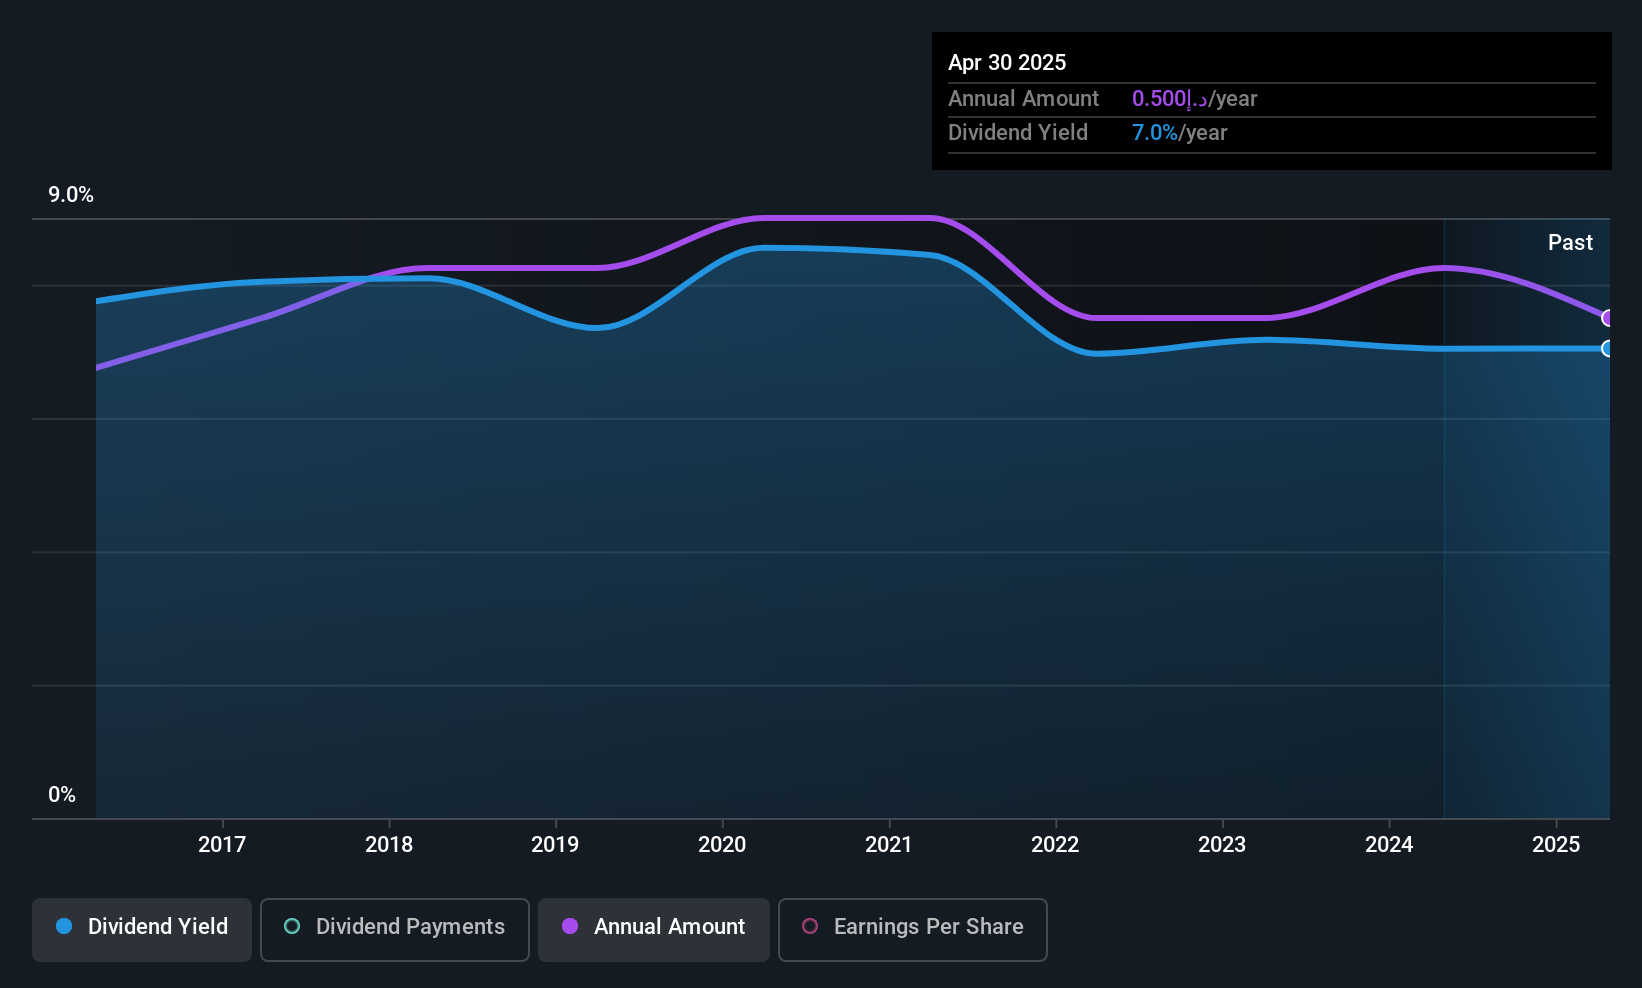
Dividend Yield: 7.9%
Emirates Insurance Company P.J.S.C. offers an attractive dividend yield of 7.89%, placing it in the top 25% of dividend payers in the AE market. The company’s dividends have been stable and growing over the past decade, supported by a reasonable payout ratio of 65.5% and a low cash payout ratio of 36.7%. Recent earnings reports show consistent profitability, with net income for fiscal year 2025 at AED 138.44 million, supporting continued dividend payments.
- Click to explore a detailed breakdown of our findings in Emirates Insurance Company P.J.S.C’s dividend report.
- The valuation report we’ve compiled suggests that Emirates Insurance Company P.J.S.C’s current price could be inflated.
Savola Group (SASE:2050)
Simply Wall St Dividend Rating: ★★★★☆☆
Overview: Savola Group Company, along with its subsidiaries, is involved in the production, marketing, and distribution of food products and has a market cap of SAR7.94 billion.
Operations: Savola Group’s revenue is primarily derived from its activities in producing, marketing, and distributing food products.
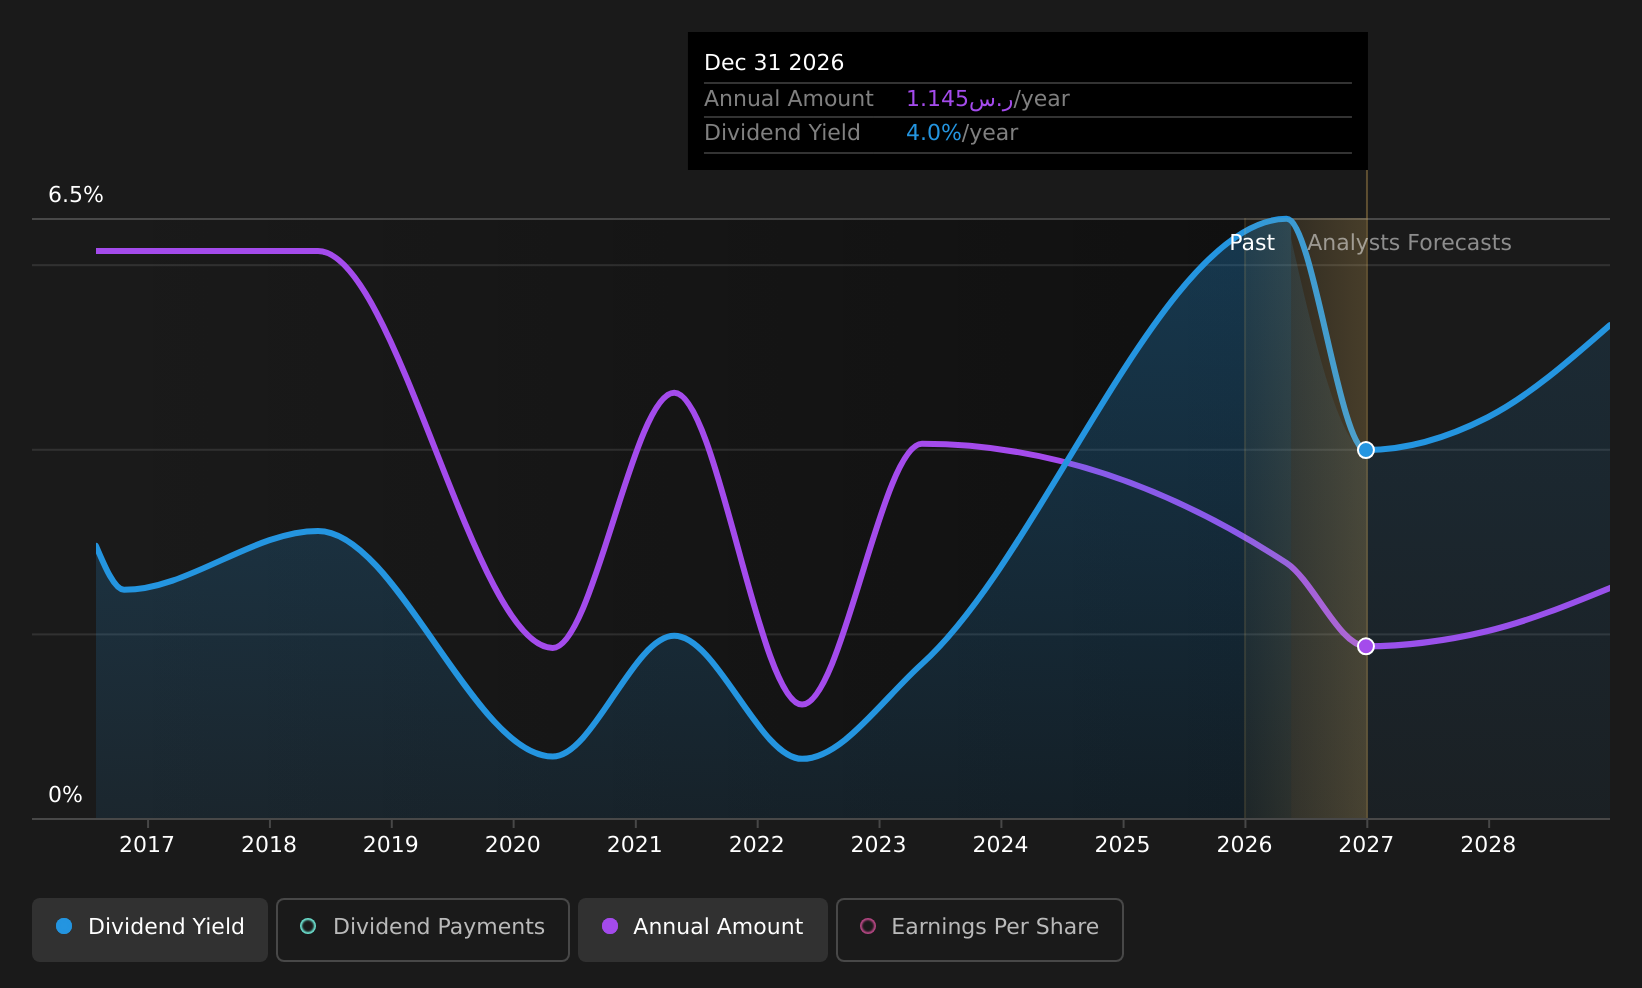
Dividend Yield: 6.6%
Savola Group’s dividend yield is among the top 25% in the Saudi Arabian market, with a payout ratio of 54.2%, indicating dividends are covered by earnings. However, its dividend history has been volatile over the past decade, and payments have decreased. Despite recent earnings improvement, with Q1 net income rising to SAR 284.52 million from SAR 189.16 million year-on-year, profit margins remain low at 3.6%. The annual dividend of SAR 1.70 per share reflects this cautious approach to payouts amidst fluctuating financial performance.
- Get an in-depth perspective on Savola Group’s performance by reading our dividend report here.
- The valuation report we’ve compiled suggests that Savola Group’s current price could be quite moderate.
Al Maather Reit Fund (SASE:4334)
Simply Wall St Dividend Rating: ★★★★☆☆
Overview: Al Maather Reit Fund is a real estate investment fund with a market capitalization of SAR552.33 million.
Operations: Al Maather Reit Fund generates revenue from various real estate segments, including Offices (SAR16.73 million), Schools (SAR6.39 million), Galleries (SAR15.71 million), Hospitals (SAR8.16 million), Warehouses (SAR6.93 million), and Hotel Suites (SAR12.80 million).
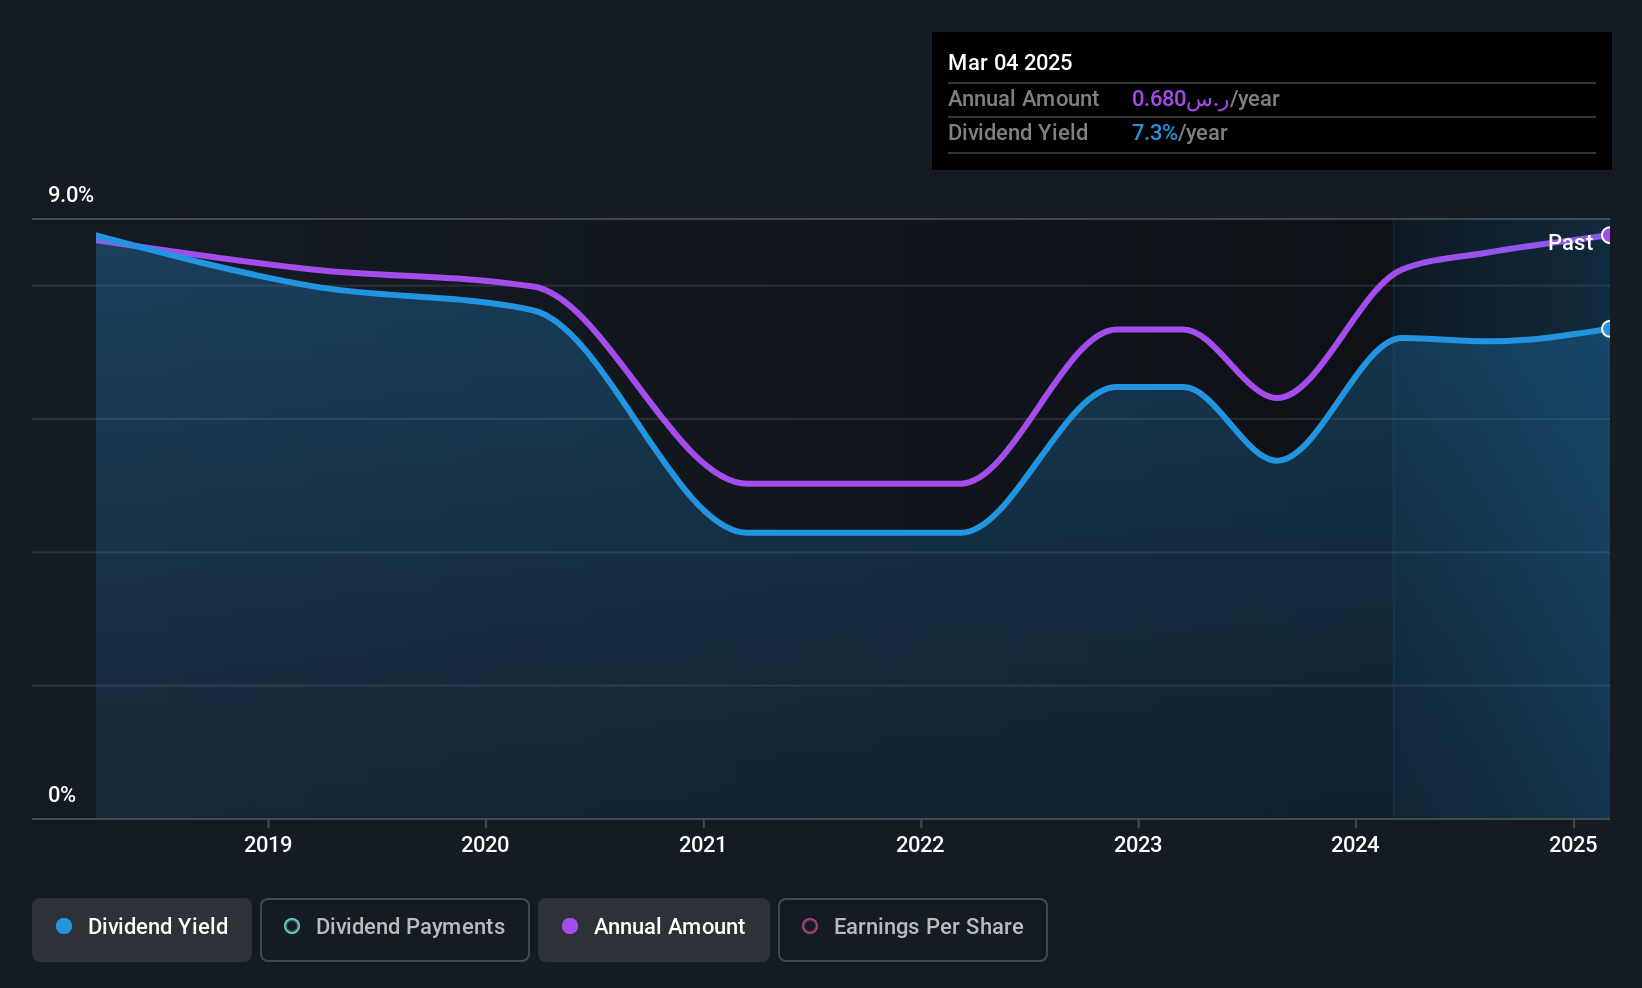
Dividend Yield: 7.4%
Al Maather Reit Fund’s dividend yield ranks in the top 25% of the Saudi Arabian market, supported by a payout ratio of 76.6%, indicating coverage by both earnings and cash flows. However, its eight-year dividend history reveals volatility and a declining trend in payments. Recent earnings show sales growth to SAR 66.96 million, yet net income declined to SAR 34.02 million from SAR 41.14 million, reflecting potential challenges in sustaining stable dividends amidst fluctuating financial results.
- Click here to discover the nuances of Al Maather Reit Fund with our detailed analytical dividend report.
- Our expertly prepared valuation report Al Maather Reit Fund implies its share price may be lower than expected.
Where To Now?
- Access the full spectrum of 60 Top Middle Eastern Dividend Stocks by clicking on this link.
- Have a stake in these businesses? Integrate your holdings into Simply Wall St’s portfolio for notifications and detailed stock reports.
- Take control of your financial future using Simply Wall St, offering free, in-depth knowledge of international markets to every investor.
Want To Explore Some Alternatives?
- Explore high-performing small cap companies that haven’t yet garnered significant analyst attention.
- Fuel your portfolio with companies showing strong growth potential, backed by optimistic outlooks both from analysts and management.
- Find companies with promising cash flow potential yet trading below their fair value.
This article by Simply Wall St is general in nature. We provide commentary based on historical data and analyst forecasts only using an unbiased methodology and our articles are not intended to be financial advice. It does not constitute a recommendation to buy or sell any stock, and does not take account of your objectives, or your financial situation. We aim to bring you long-term focused analysis driven by fundamental data. Note that our analysis may not factor in the latest price-sensitive company announcements or qualitative material. Simply Wall St has no position in any stocks mentioned.
Valuation is complex, but we’re here to simplify it.
Discover if Emirates Insurance Company P.J.S.C might be undervalued or overvalued with our detailed analysis, featuring fair value estimates, potential risks, dividends, insider trades, and its financial condition.
Have feedback on this article? Concerned about the content? Get in touch with us directly. Alternatively, email editorial-team@simplywallst.com