Major market indexes are climbing toward new highs, but many investors have mixed feelings about the stock market right now.
Around 48% of investors feel pessimistic about the next six months, according to a June 2026 survey from the American Association of Individual Investors, while 30% feel optimistic and the remaining 22% are neutral.
The not-so-good news about the market’s future is that some popular indicators suggest volatility could be on the horizon. However, history is also certain on one thing: The market’s long-term outlook is incredibly promising.

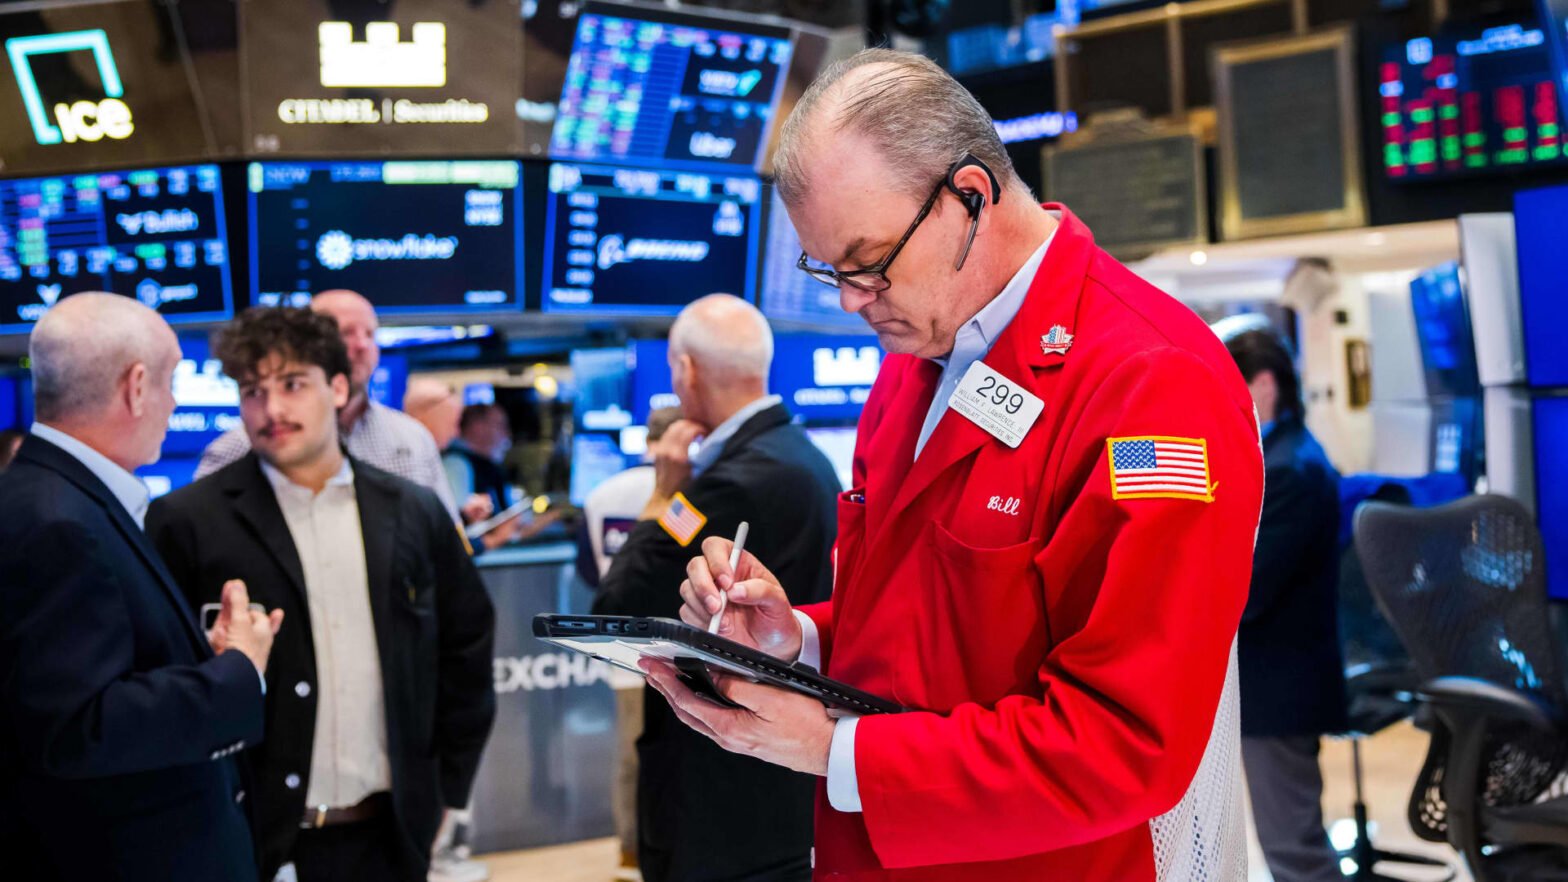
Image source: Getty Images.
Here’s what the data suggests
First, it’s important to emphasize that no stock market metric can predict the future. If it could, all investors would be timing the market perfectly. That said, these metrics can still serve as a temperature gauge for valuations.
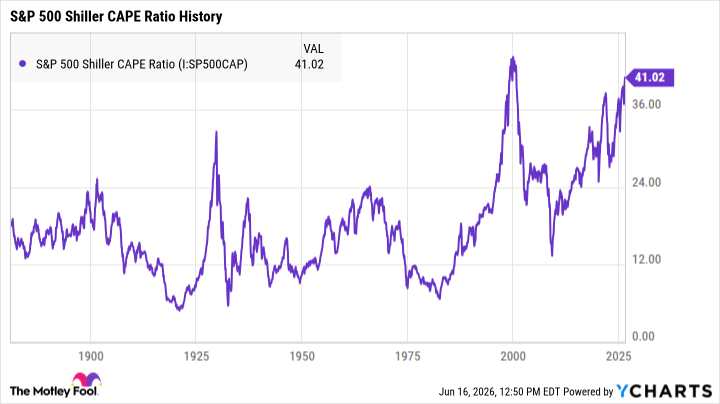
One popular indicator is the S&P 500 Shiller CAPE ratio, which compares the price of the S&P 500 (^GSPC +1.15%) with its 10-year inflation-adjusted earnings. This metric provides a longer-term view of how the index’s valuation has changed, helping investors determine whether the market is over- or undervalued.
Historically, this ratio averages around 17. It reached an all-time high of around 44 just before the dot-com bubble burst in the early 2000s, and as of this writing, it’s climbed to just over 41 — the second highest point in history.
S&P 500 Shiller CAPE Ratio data by YCharts
The Buffett indicator is another metric that measures valuations, though in a slightly different way. Popularized by Warren Buffett after he used it to predict the dot-com bubble, the ratio measures the relationship between total U.S. market capitalization and GDP.
In an interview with Fortune magazine explaining how he interprets this data, Buffett noted that the ideal time to buy stocks is when the ratio is around 70% to 80%. “If the ratio approaches 200%,” he warned, “you are playing with fire.” In June 2026, the Buffett indicator reached a new high of over 233%.
The promising news for investors
These metrics may be sounding the alarm, but again, no market indicator will be 100% accurate. Both the S&P 500 Shiller CAPE ratio and the Buffett indicator have been on the rise for years, and if you’d gotten out of the market at the first hint of overvaluation, you’d have missed out on potentially lucrative growth.
The best thing investors can do right now, then, is stay focused on the market’s long-term potential. If history shows us anything, it’s that stocks can survive nearly anything with enough time.
Say, for example, you invested in an S&P 500 ETF or index fund in January 2000. That would have been a rough time to buy, as the market was on the verge of what would become one of the longest bear markets in history. By the time the S&P 500 finally began reaching new record highs, the Great Recession began shortly after.
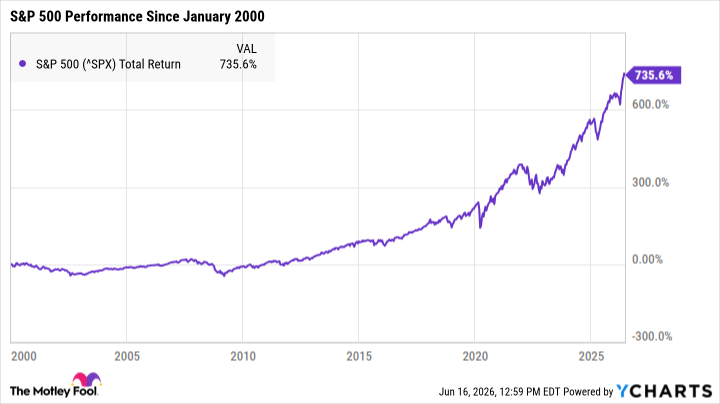
By today, however, the S&P 500 has delivered total returns of more than 735% — despite multiple record-breaking downturns over the last two decades.
Nobody can say where the market is headed in the short term. However, history has proven time and time again that strong stocks can be lucrative over time, and keeping a long-term outlook is perhaps the single best way to build life-changing wealth in the stock market.