Warren Buffett’s favorite market valuation measure is at a record high, suggesting that the stock market is exceedingly expensive. Specifically, the total market capitalization of the U.S. stock market is now 136% greater than the nation’s gross domestic product, or GDP. That’s roughly 70% above the long-term norm.
The narrative surrounding this indicator’s surge since the bull market began in late 2022 is bearish, of course, and perhaps rightly so.
Missed Nvidia in 2009? This Rare Signal Is Flashing Again. In 2009, a “Double Down” signal flashed for a little-known chipmaker called Nvidia. For the first time in years, that same “Total Conviction” signal is flashing for a company 1/100th the size of Nvidia. Continue »
However, there may also be a gaping flaw in the very premise of the Buffett indicator.
Not the same
Don’t misread the message. Warren Buffett isn’t just a brilliant stock picker. He’s also got a great feel for how the economy and the stock market affect one another.
This particular approach to assessing the overall market’s value, however, isn’t necessarily one worth worrying about.
The sum total market cap of every publicly listed U.S. stock specifically doesn’t include privately owned for-profit corporations. Nor does the so-called Buffett indicator consider the combined profitability of these companies, which is considerably greater (absolutely and relatively) than it used to be.
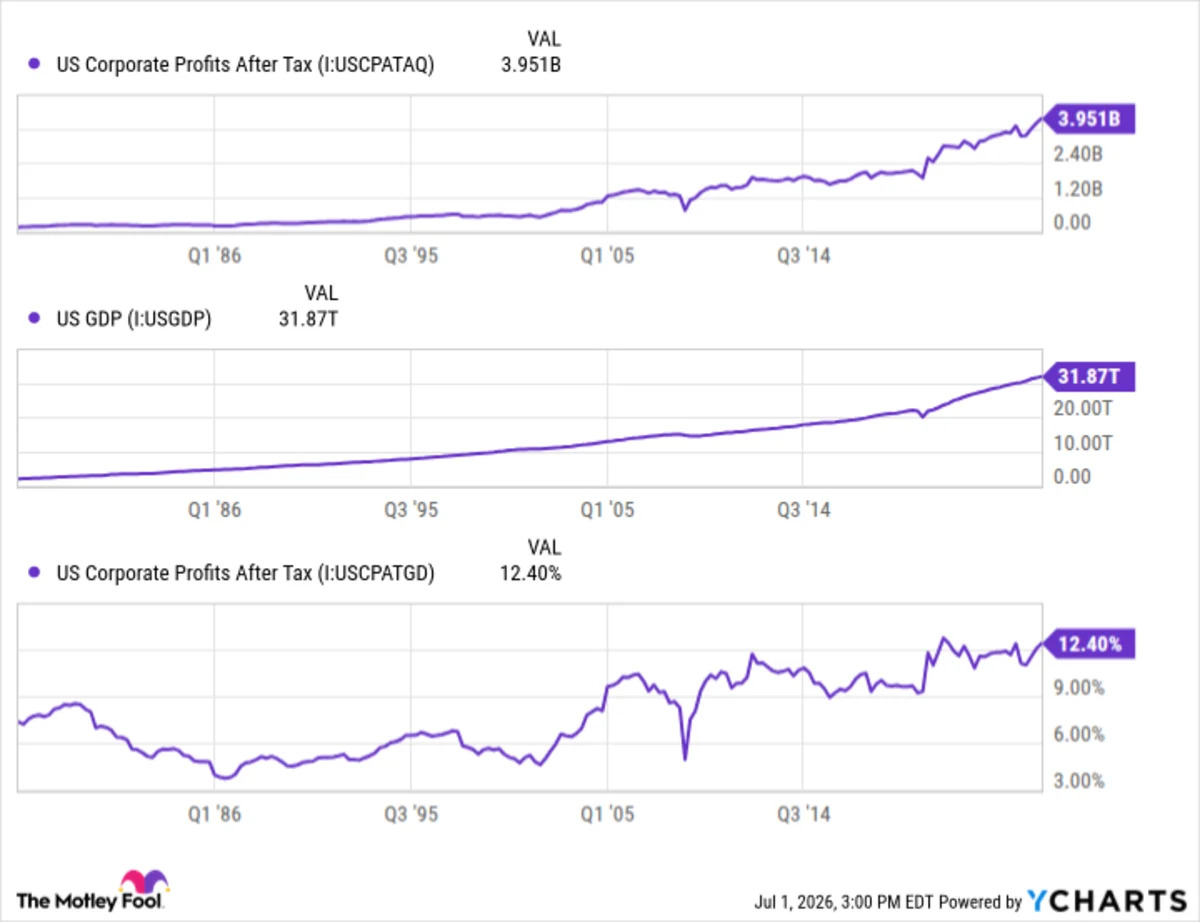
The chart below tells the tale, comparing taxable corporate profits to the same domestic GDP used in Warren Buffett’s valuation measure going back to the 1970s. As it illustrates, corporate profits are now in the ballpark of 12% of the nation’s GDP. That’s roughly twice what they were just a few decades ago.

U.S. Corporate Profits After Tax data by YCharts.
Yes, you’re seeing and interpreting that right. America’s corporate profit growth has dramatically outpaced the nation’s GDP growth, boosted by a steady widening of profit margins, as well as more earnings coming from overseas. Indeed, FactSet reports that more than 40% of S&P 500 (SNPINDEX: ^GSPC) companies’ first-quarter revenue came from foreign economies that don’t affect the United States’ GDP figure.
From this perspective, the market isn’t overvalued. The S&P 500 is reasonably valued, in fact, at a forward-looking price-to-earnings ratio of 21.5.
No longer a measure to worry about
It’s no shade on Buffett’s valuation model, which he never claimed is an end-all, be-all anyway. It’s just one of many pieces of information that all investors should consider before coming to a conclusion about the broad market’s value and likely future.