Key Points
-
The S&P 500 has been on a fantastic run in recent years and is now on the precipice of hitting an all-time high valuation.
-
Investors are rightfully nervous, having seen a similar story unfold before.
-
Investors need to consider their goals and where they are in their investing journey before deciding what to do next.
It’s been a fun few years for the stock market. Ever since the broader S&P 500 (SNPINDEX: ^GSPC) index crashed by 20% in 2022, the market has enjoyed a fast-and-furious bull run.
Much of that has been driven by artificial intelligence (AI), as investors have poured into stocks they see as the largest beneficiaries of a technology that could fundamentally change every aspect of society.
Where to invest $1,000 right now? Our analyst team just revealed what they believe are the 10 best stocks to buy right now, when you join Stock Advisor. See the stocks »
The question is whether AI will be a different supercycle than those before it, even during some of the most bullish times in stock market history.
This theory will soon be put to the test, because the stock market just flashed a warning sign seen only one other time since 1890. History couldn’t be any clearer about what comes next.
Person holding head with one hand while looking intently at laptop.
Image source: Getty Images.
Stocks are testing all-time-high valuations
For investors who follow the market, it should come as no surprise that stocks are nearing all-time-high valuations. After all, while there have been some pullbacks along the way, the stock market has been on a multiyear bull run.
Stocks have managed to overcome a banking crisis in 2023; one of the fastest-rising interest rate cycles in decades; a decrease in the Federal Reserve’s balance sheet, which effectively pulls liquidity out of the market; and President Donald Trump’s tariff rates on most of the country’s largest trading partners, which immediately sent the market into a steep sell-off. They have also bounced back from the Iran war, which has sent oil prices surging and even made investors forecast interest rate hikes later this year.
Despite all of this, the market has reached nearly all-time highs on several metrics, one being the S&P 500 Shiller CAPE ratio.
This metric looks at the value of the S&P 500 compared to a 10-year average of inflation-adjusted earnings, which are used to smooth out irregularities in the economic cycle.
S&P 500 Shiller CAPE Ratio Chart
S&P 500 Shiller CAPE Ratio data by YCharts.
The chart above shows that the market has a Shiller CAPE ratio of nearly 41.4 at recent prices. That’s well over double the historical average and not far from the level reached during the dot-com bubble in 2000.
That time period is similar to the current AI boom. The internet had just achieved mainstream adoption, and tech investors believed it would change everything. Companies were spending hundreds of billions on infrastructure, such as fiber-optic cables, to make the internet ubiquitous.
While this ultimately came to fruition, there was pain first: Companies overbuilt infrastructure, valuations became unsustainable, and eventually the well of capital funding this extravagant boom ran dry.
How investors should prepare
There are clearly many similarities between the dot-com bubble and the current market, so investors should be on high alert. That said, investors should also note that while history rhymes, it rarely repeats itself.
I find it very unlikely that investors will be able to predict the cause of the next major crash, so whatever pundits, experts, and the media are predicting is unlikely to be the actual cause. Crashes usually stem from an unforeseen issue that catches everyone off guard.
It’s also possible that, as in the late 1990s, the market will continue to run for several years before a significant pullback or crash occurs.
The big thing investors need to assess is where they are in their investing journey. If you still have a 10- or 20-year runway ahead, there may be no need to change your portfolio at all, particularly if it is mostly in diversified index funds.
However, if you are holding individual stocks, you should review valuations to see which are trading at meteoric levels and which are more reasonably priced. For the companies that trade at sky-high valuations, what kind of growth would it take to make them worth today’s prices? (Here’s a helpful guide to valuation.)
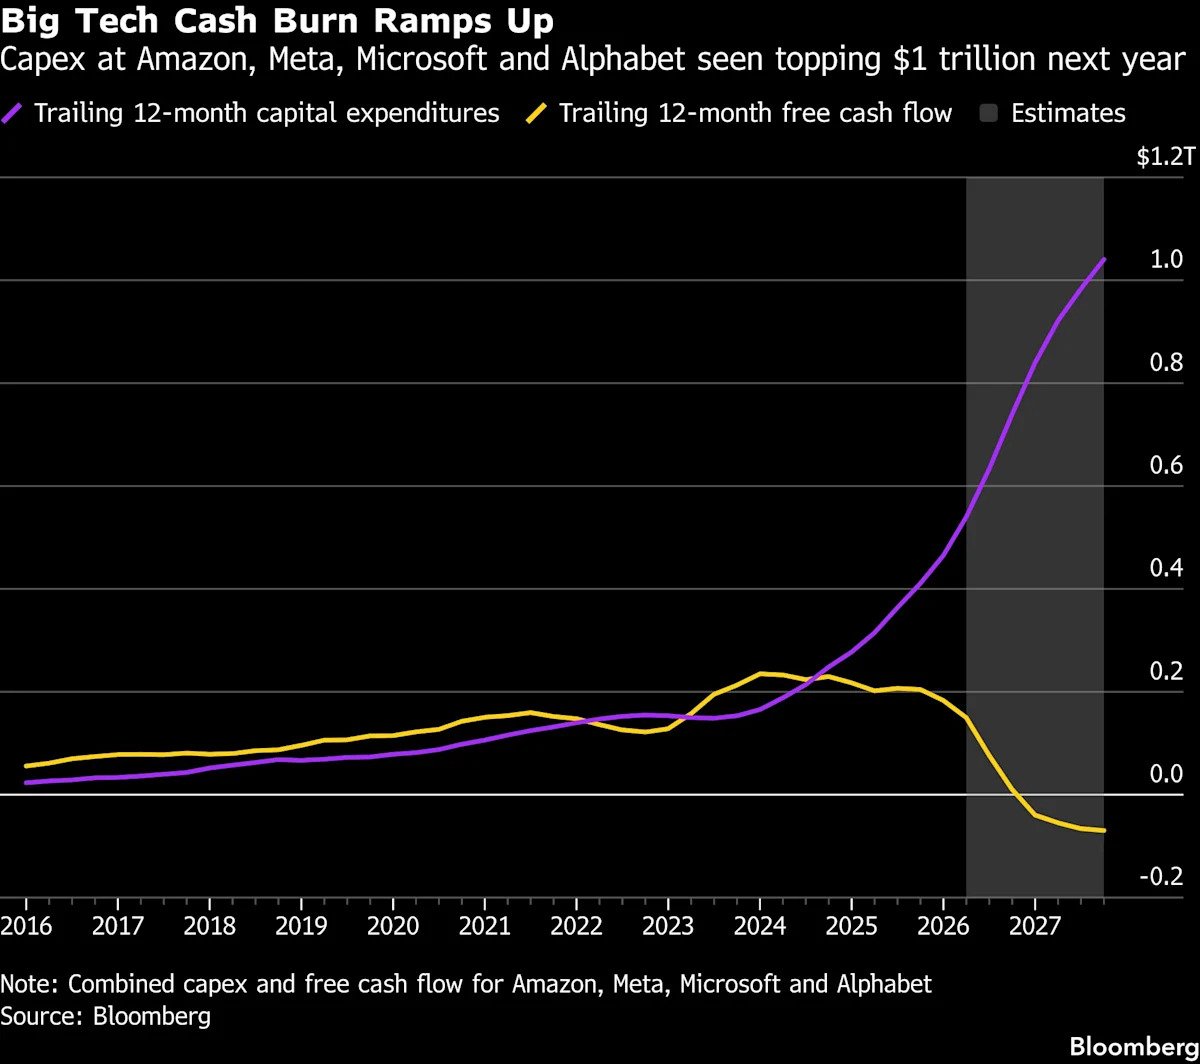
Even for companies like the “Magnificent Seven,” which consume much of the S&P 500, if the AI trade falters, their earnings could take a hit, and they could get left holding the bag on hundreds of billions in capital expenditures they’ve spent to build out AI infrastructure. That doesn’t mean they are all done for, but there could be some painful years ahead before a recovery.
Imagine your portfolio crashing 20% or more as a new bear market takes hold. If you don’t need that cash any time soon and you can tolerate the volatility, you might not need to change much. Otherwise, it may be time to diversify into less concentrated investments. You might consider an equal-weighted index fund like the Invesco S&P 500 Equal Weight ETF (NYSEMKT: RSP), which gives you all the benefits of diversification without putting too much weight in the biggest stocks (the S&P 500 is weighted by market cap, and the 10 largest components make up nearly 40% at recent prices).
The most important thing is that investors assess their portfolios and make a plan, so they are appropriately prepared for whatever may come.
Should you buy stock in S&P 500 Index right now?
Before you buy stock in S&P 500 Index, consider this:
The Motley Fool Stock Advisor analyst team just identified what they believe are the 10 best stocks for investors to buy now… and S&P 500 Index wasn’t one of them. The 10 stocks that made the cut could produce monster returns in the coming years.
Consider when Netflix made this list on December 17, 2004… if you invested $1,000 at the time of our recommendation, you’d have $395,679!* Or when Nvidia made this list on April 15, 2005… if you invested $1,000 at the time of our recommendation, you’d have $1,294,805!*
Now, it’s worth noting Stock Advisor’s total average return is 929% — a market-crushing outperformance compared to 211% for the S&P 500. Don’t miss the latest top 10 list, available with Stock Advisor, and join an investing community built by individual investors for individual investors.
*Stock Advisor returns as of July 12, 2026.
Bram Berkowitz has no position in any of the stocks mentioned. The Motley Fool has no position in any of the stocks mentioned. The Motley Fool has a disclosure policy.