So far, so good. We predicted a summer stall in the stock market, with bouts of volatility rather than a correction, and that is how June and July played out. The S&P 500 has gone nowhere since May 14, fluctuating around 7,500, while the market has churned underneath. The rotation of leadership among sectors that we expected has continued. Breadth has improved. Nothing in the past month has changed our view that the index should reach 8,250 by year-end.
The summer stall could last until the start of the fall. On the plus side for investors is Fabulous Earnings Momentum (FEMO). On the negative side for them are ongoing uncertainties about the AI business model, the Middle East war, the persistence of inflation, and the Fed’s reaction function under Fed Chair Kevin Warsh. The net result so far has been a flat market with lots of volatility.
Such volatility combined with leverage can be fatal. Leopold Aschenbrenner’s $45 billion hedge fund, Situational Awareness, blew up last week. He was forced to sell his entire book of public equities to Citadel after losses on his long positions in the AI trade triggered margin calls. This event undoubtedly contributed to last week’s volatility, as did Warsh’s lame first press conference; yet the S&P 500 rose 1.0% for the week!
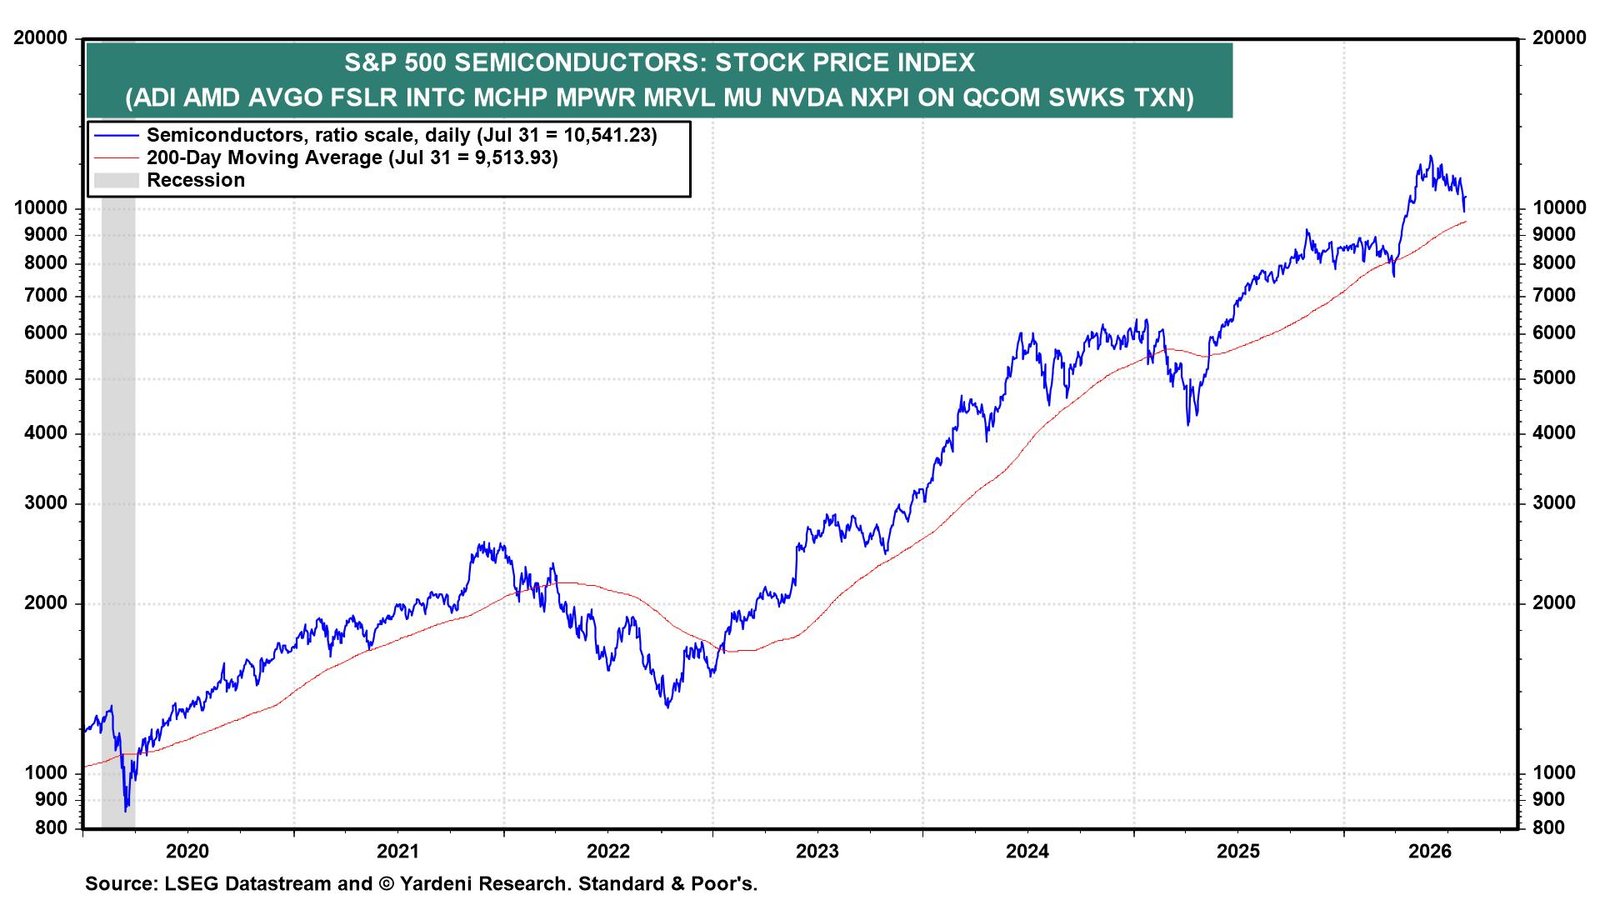
S&P 500 Semiconductors contributed to the week’s downside volatility, falling 3.4% (chart). On July 19, we wrote that the S&P 500 Semiconductors stock price index was likely to fall to its 200-day moving average.
Now let’s take a deeper dive below the market’s calm surface:
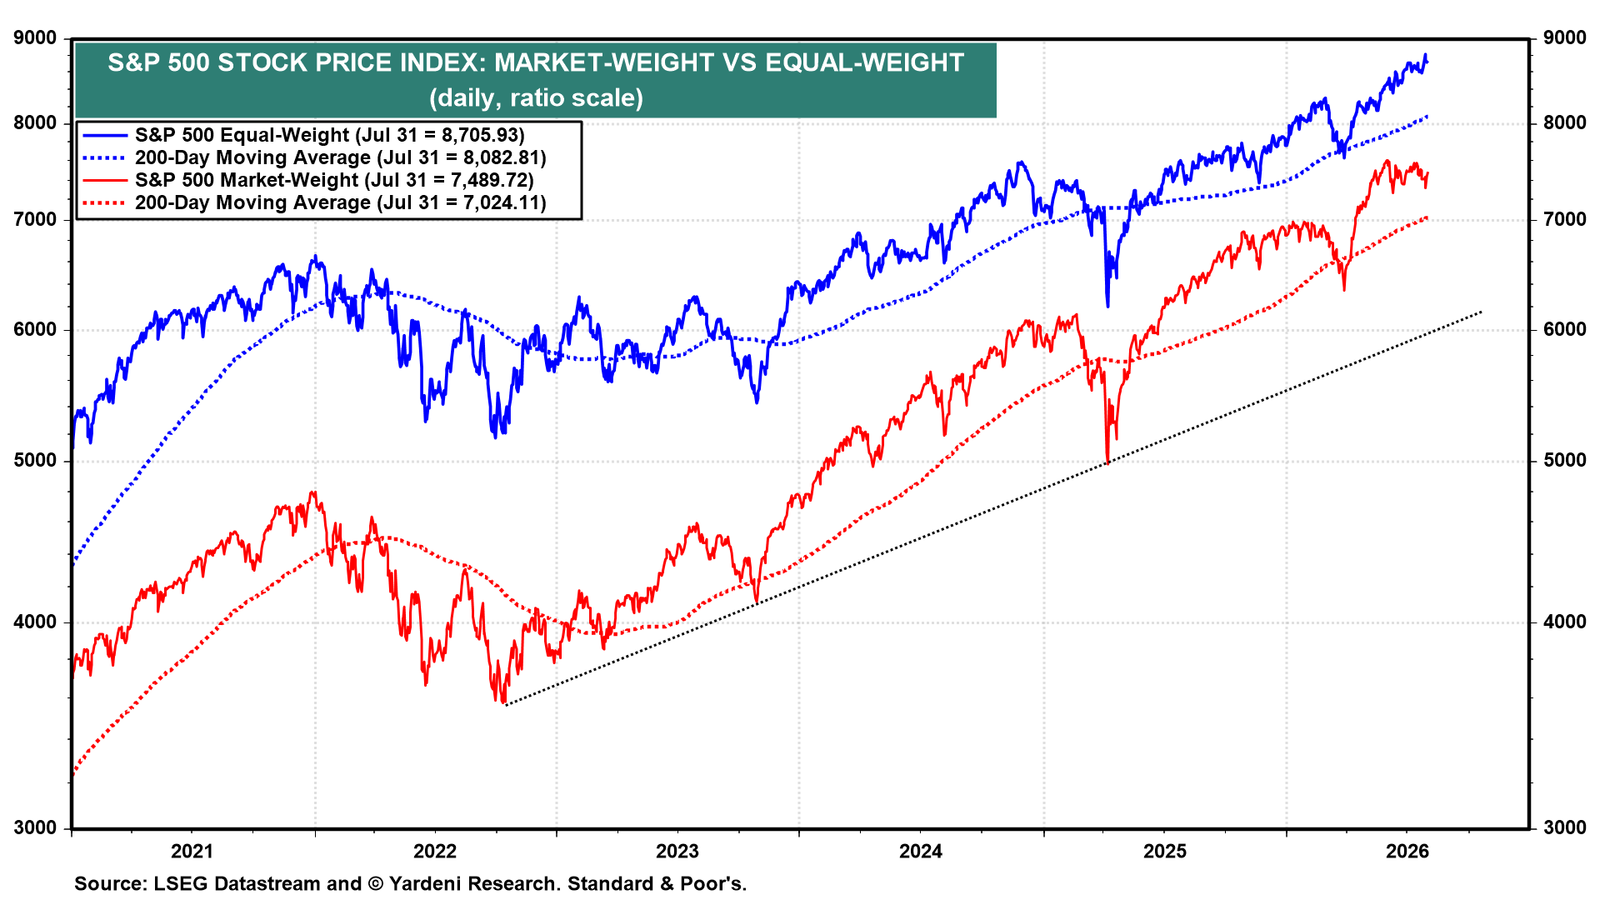
(1) Breadth. The S&P 500 equal-weight index continues to outpace the market-weight index, with the former up 12.1% ytd versus 9.4% for the latter (chart).
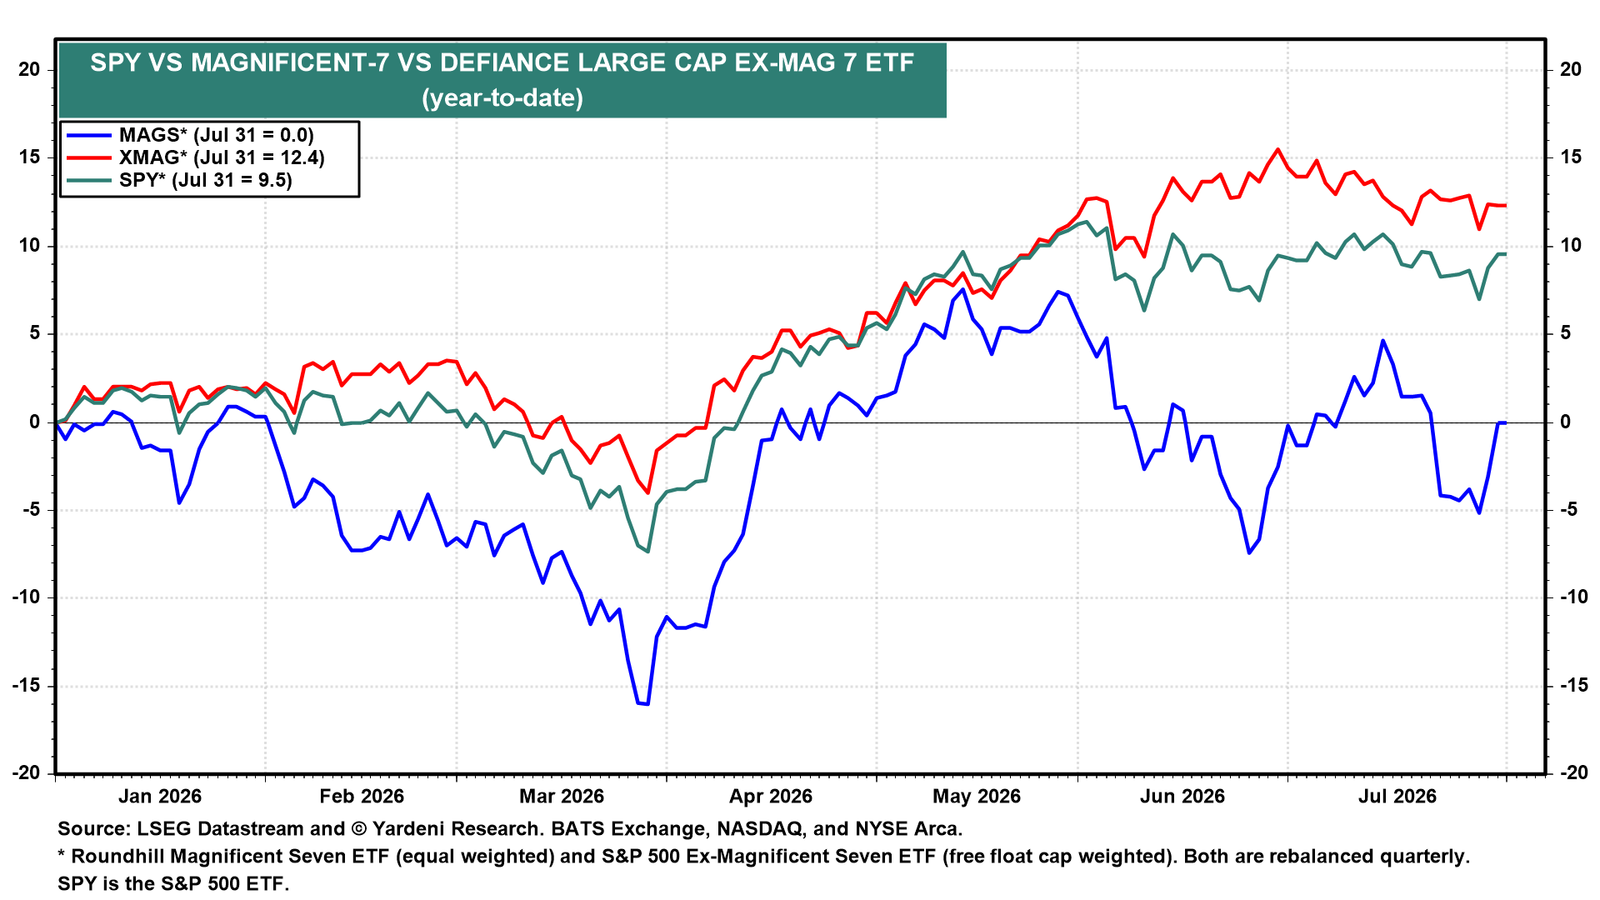
The Impressive 493 has beaten both the Magnificent-7 and the S&P 500 by wide margins ytd (chart). The Mag-7 closed the gap a bit in recent days, driven by strong results from Microsoft and Amazon.
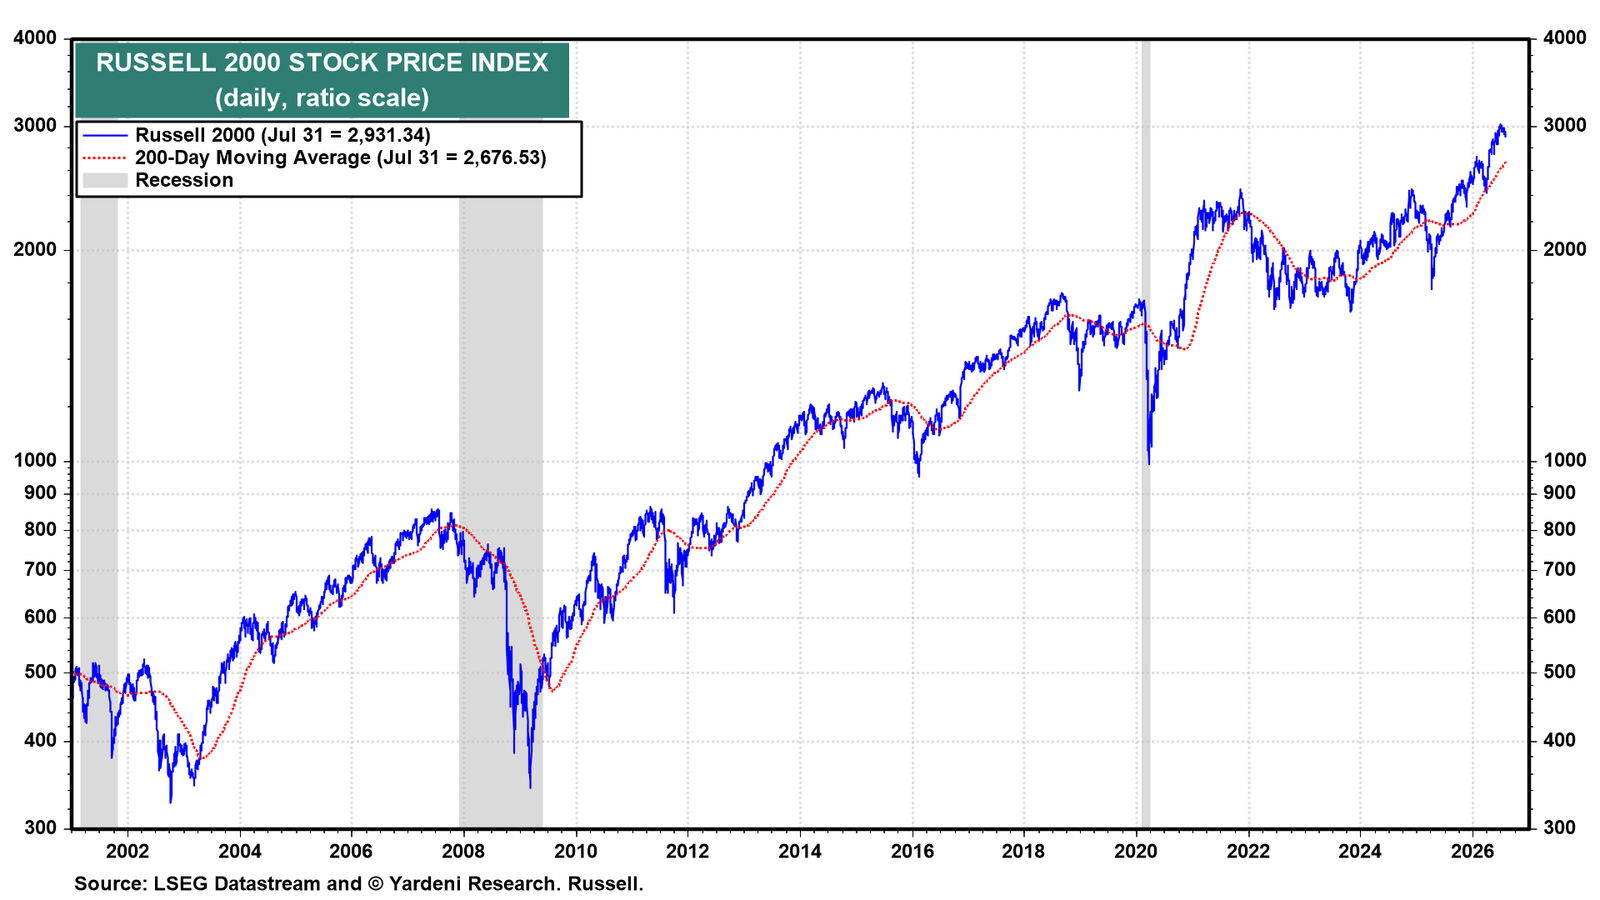
The Russell 2000 is trading near a record high, up 18.1% ytd (chart). SmallCaps wouldn’t be leading if investors thought that a recession is likely.
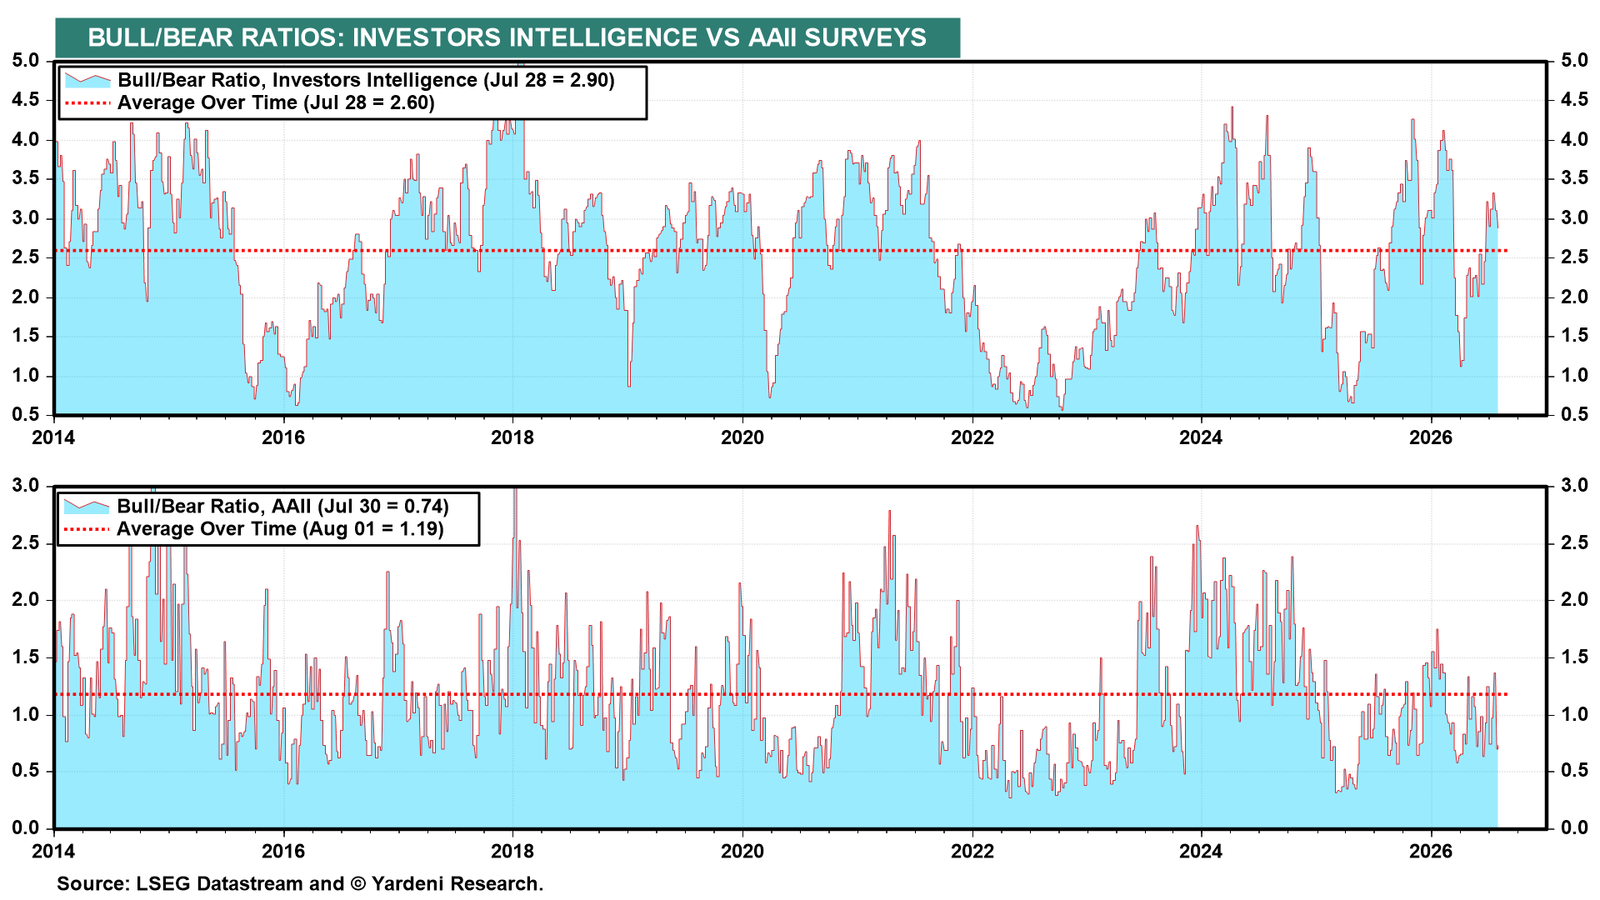
(2) Sentiment. The bull-bear stock market sentiment ratios (BBRs) are mixed. The Investors Intelligence BBR is modestly above its historical average, while the AAII ratio is well below its own (chart). Retail investors are more bearish than institutional investors on balance.
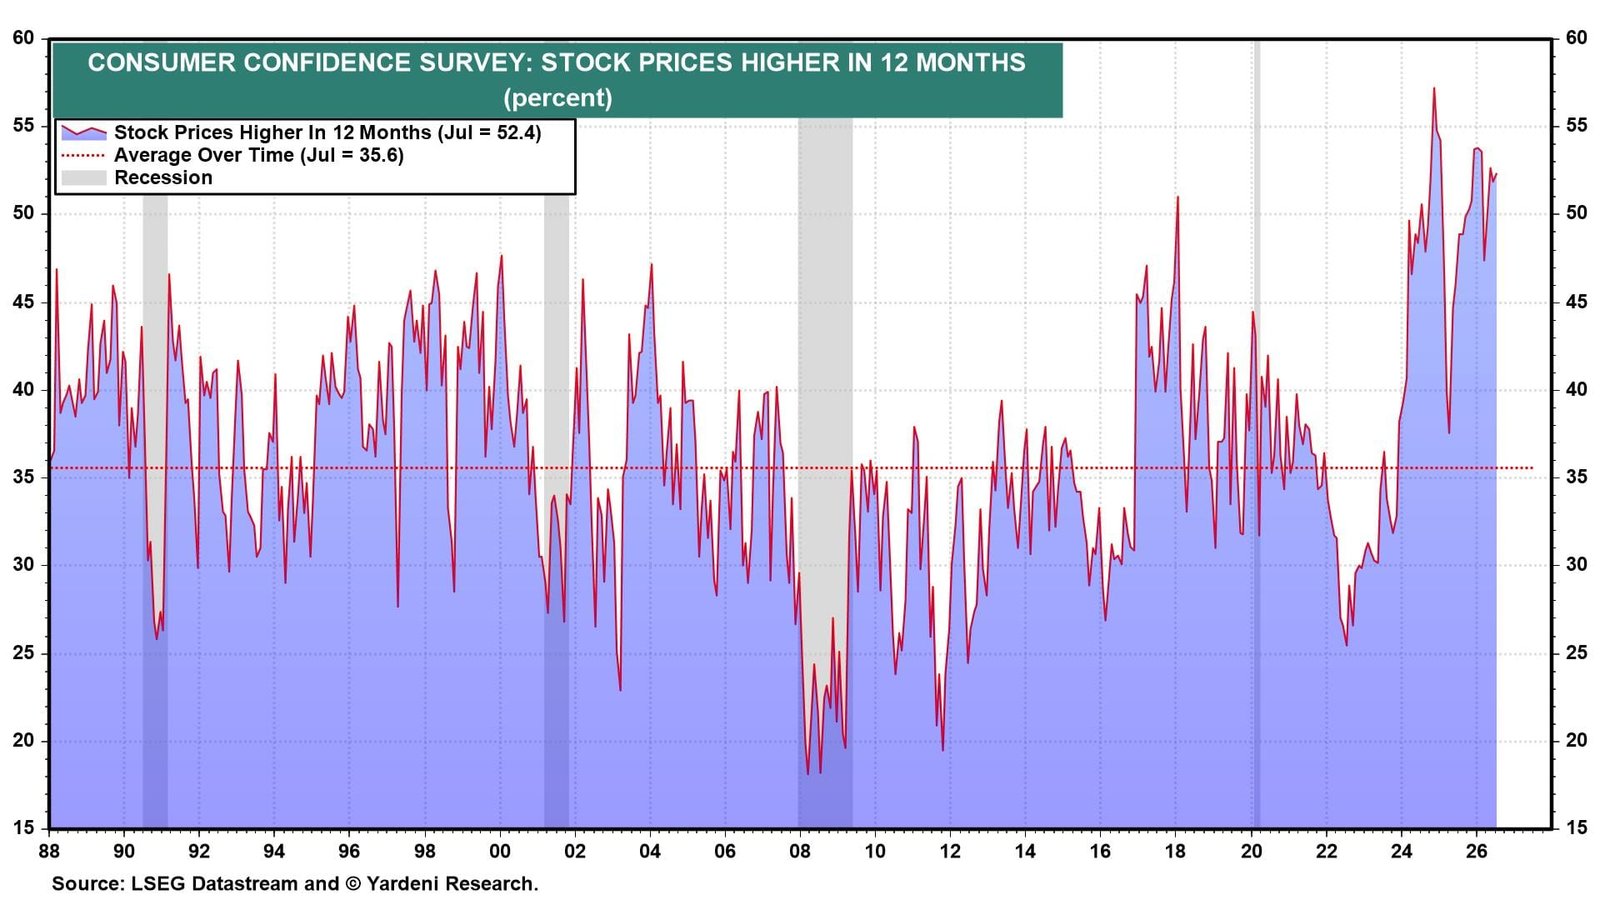
On the other hand, according to the Consumer Confidence Index (CCI) survey, the percentage of respondents expecting higher stock prices over the next 12 months, at 52.4% in July, is well above its long-run average of 35.6% (chart). This series reflects a longer forecasting horizon than the BBRs.
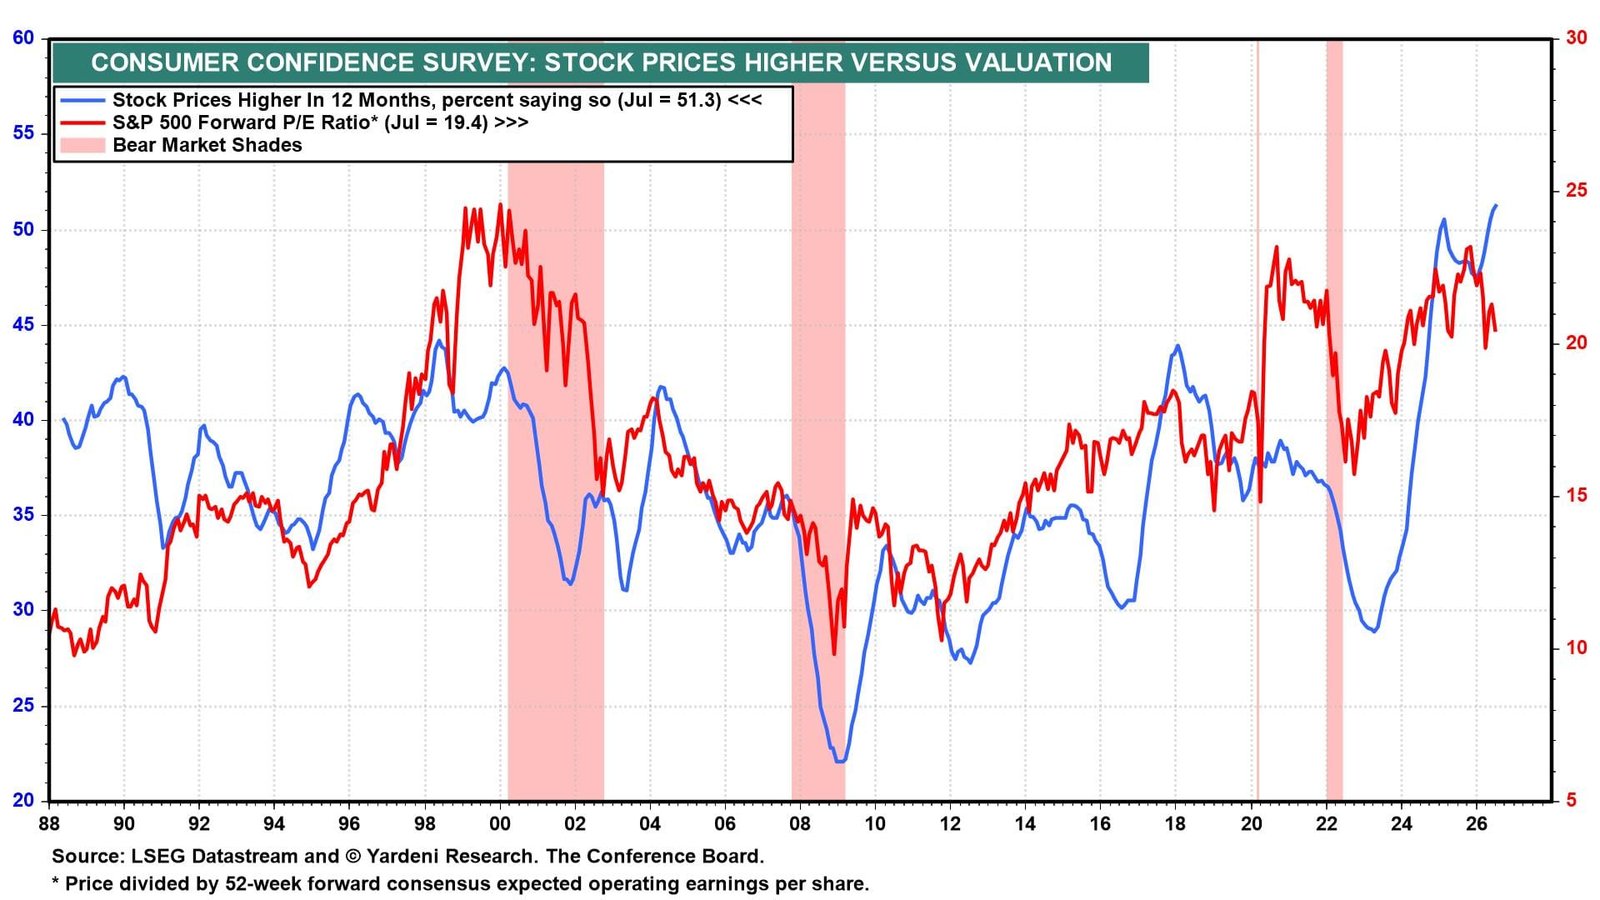
(3) Valuation. The forward P/E of the S&P 500 is well correlated with the CCI stock market bullishness series (chart). The former is relatively elevated because most investors don’t expect a recession anytime soon so do expect stock prices to move higher.
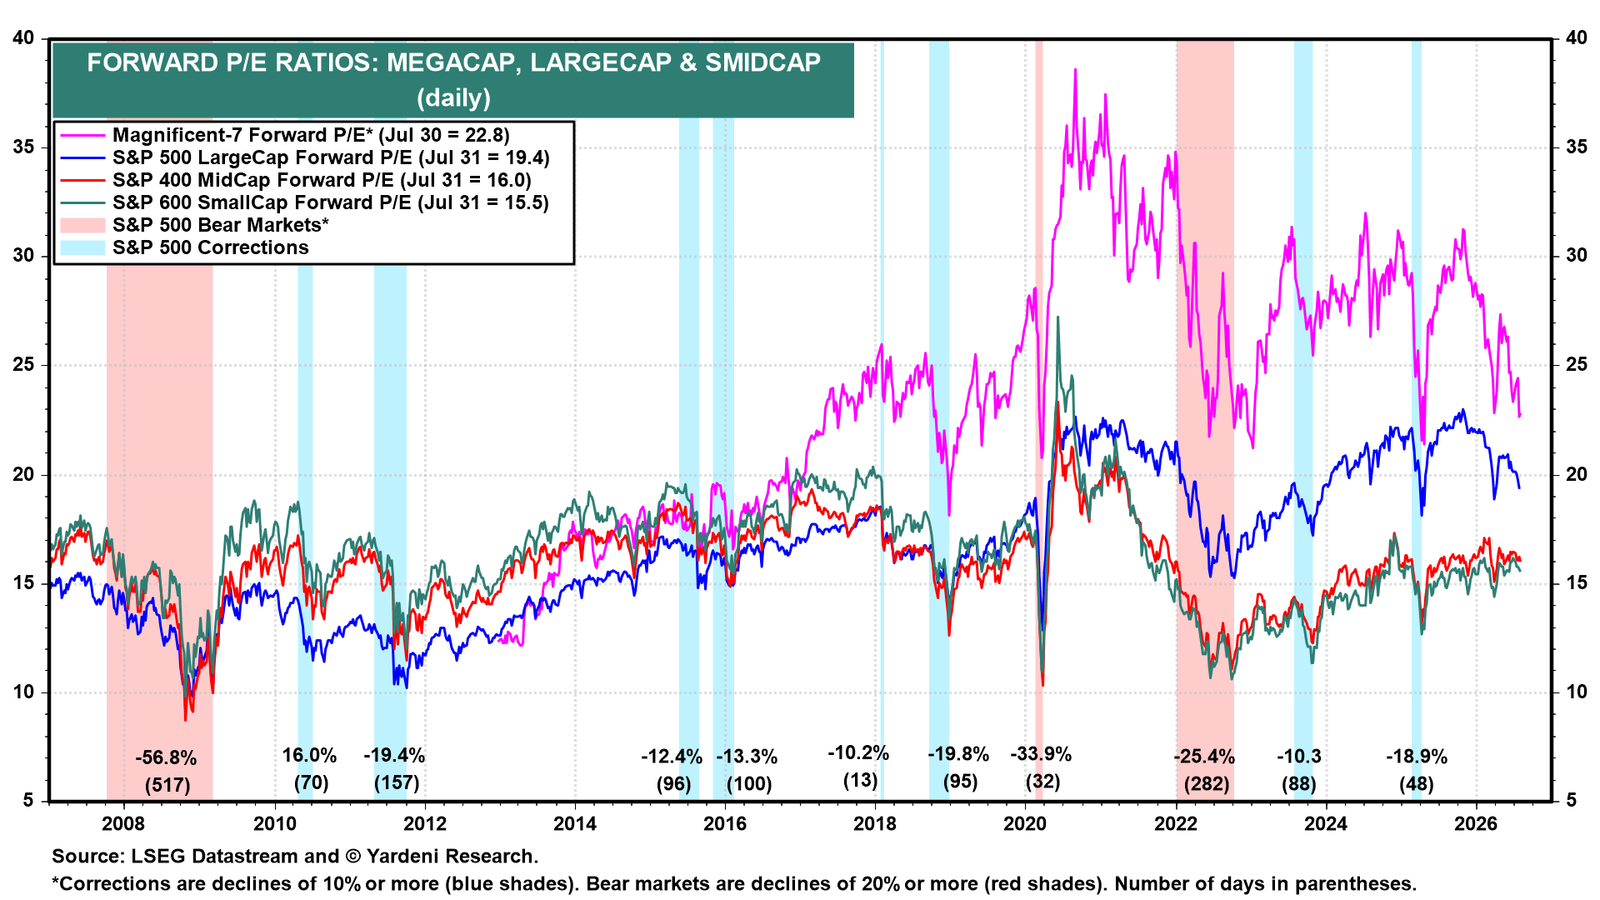
The Magnificent-7’s collective forward P/E is down to 22.8. That’s partly because Alphabet and Amazon earnings were boosted by mark-to-market (MTM) investment gains (chart). This development also lowered the S&P 500 forward P/E to 19.4. Such gains were not relevant to the S&P 400 and S&P 600, which remain relatively cheap.
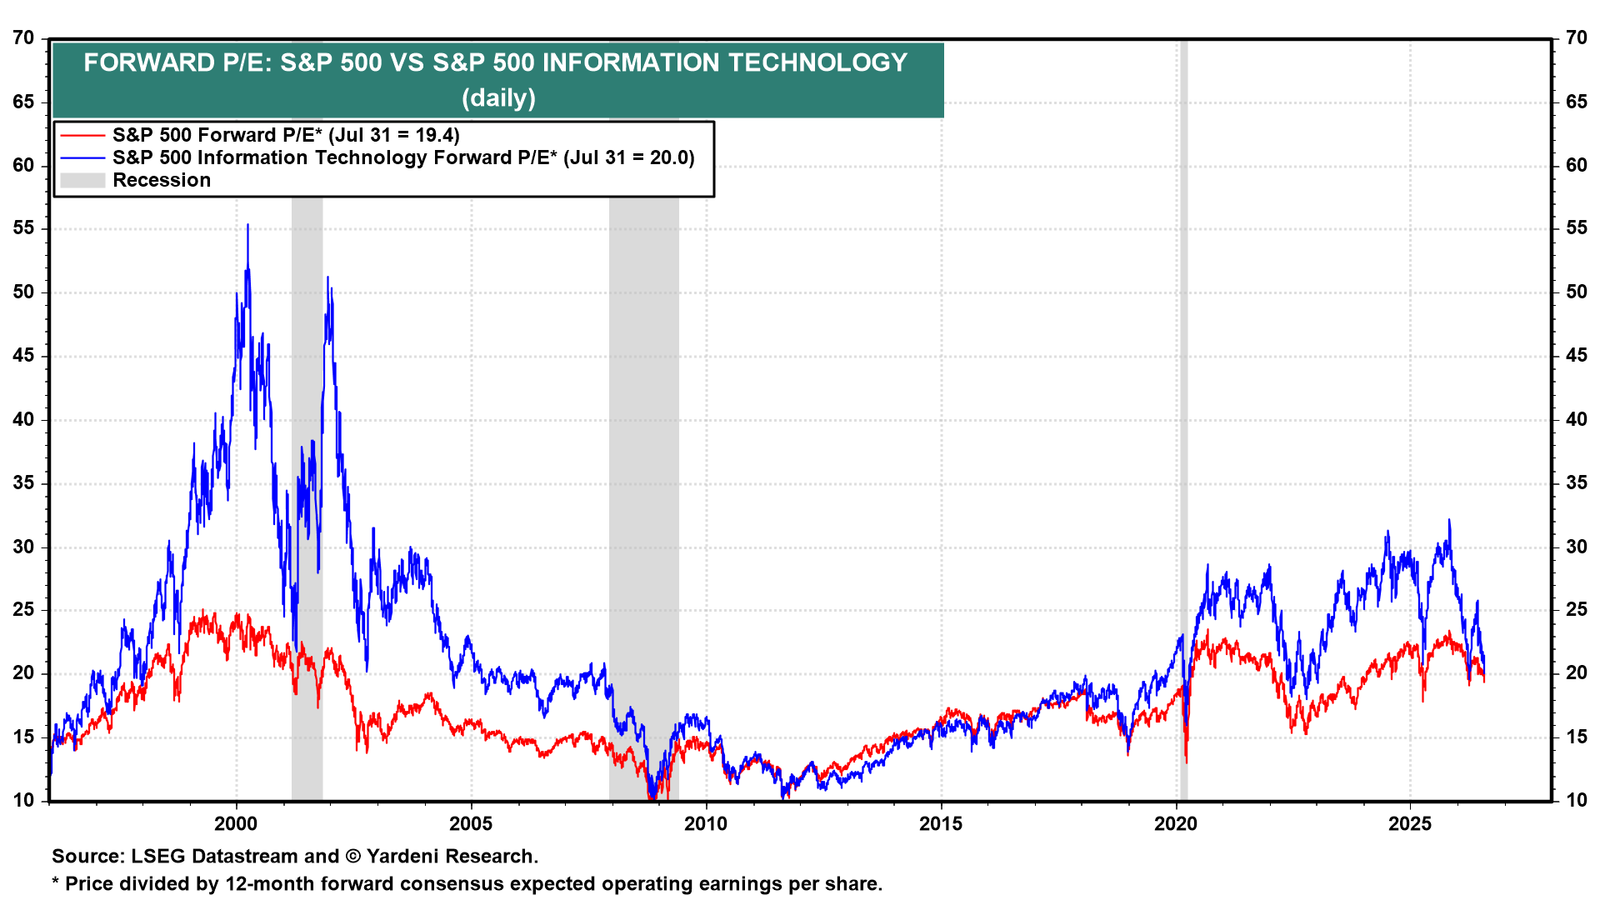
Comparisons to the 1999 Tech Bubble are looking less and less credible. The S&P 500 Information Technology sector’s forward P/E is 20.0, just 0.6 points above the S&P 500’s 19.4 (chart). At the 2000 peak, the gap was as wide as 30 points.
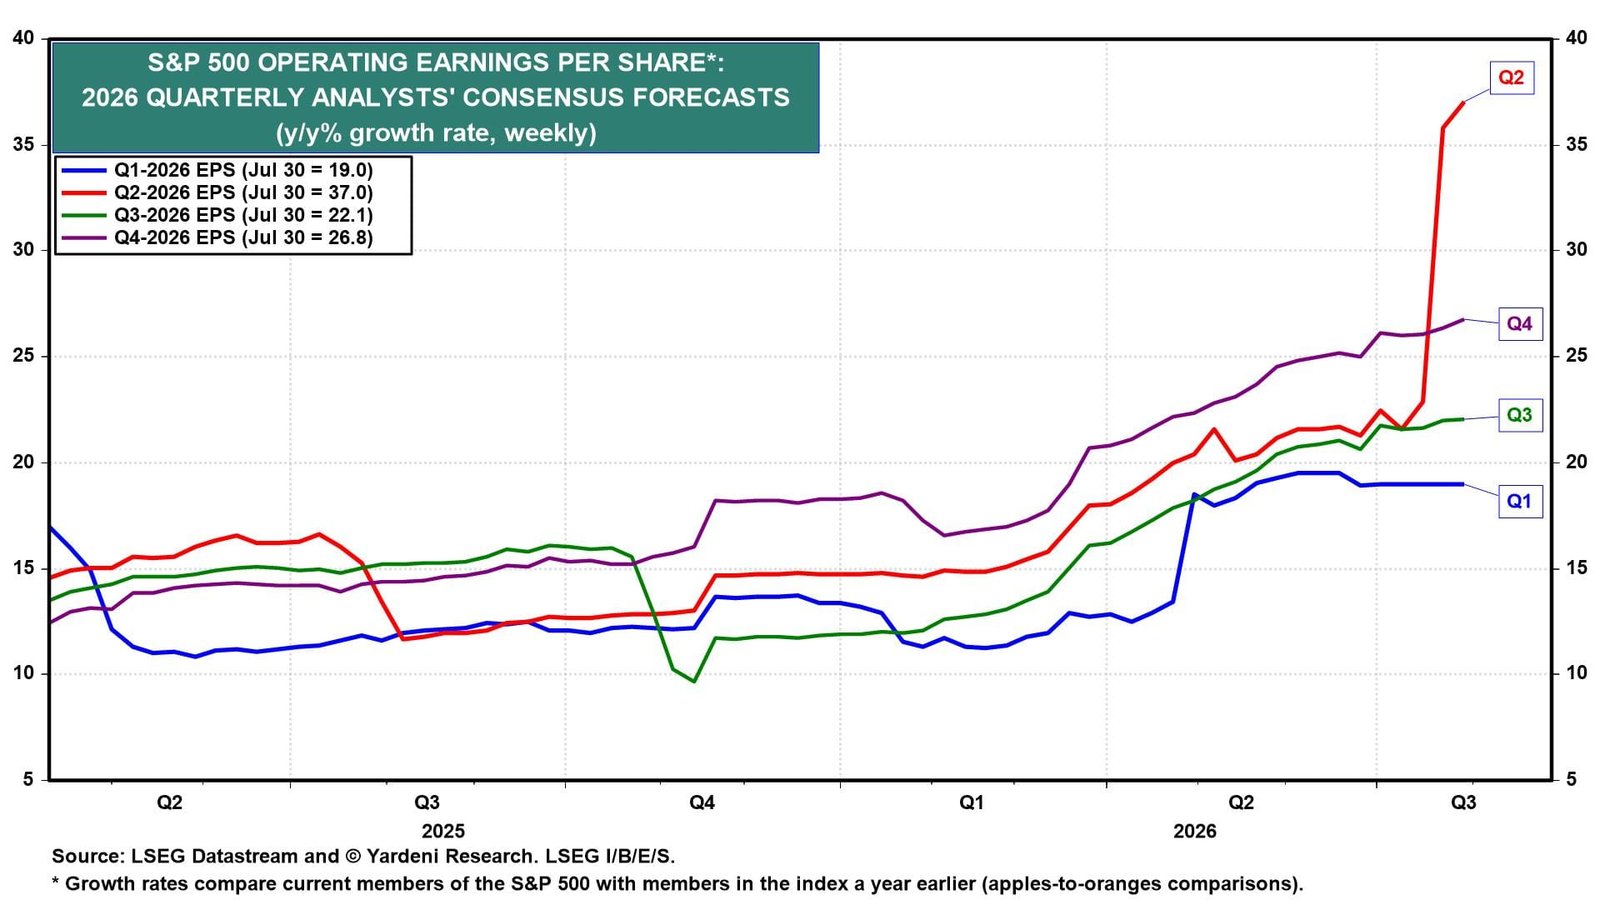
(4) Earnings. Earnings continue to deliver. Q2 earnings growth of 37.0% y/y was inflated by the MTM gains we flagged last week, but Q3 and Q4 are rising on their own merits, to 22.1% and 26.8% respectively (chart).
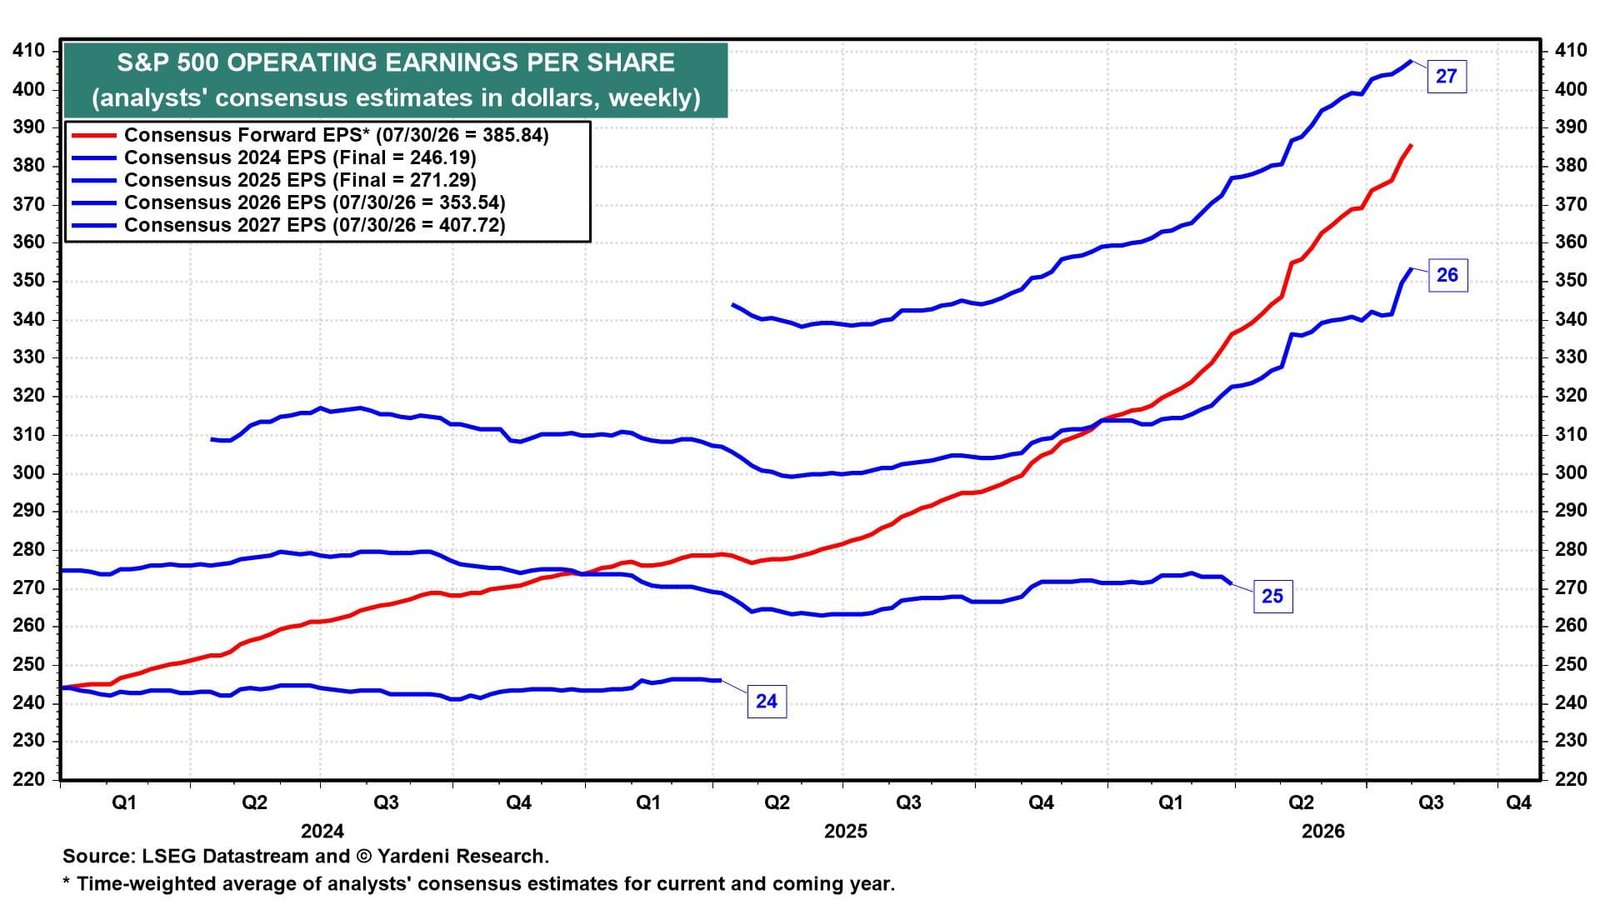
We are increasingly focused on analysts’ consensus earnings-per-share expectations for 2027. It continues to set new highs without any MTM distortion, at $407.72 last week (chart). That estimate is a clean read on FEMO.
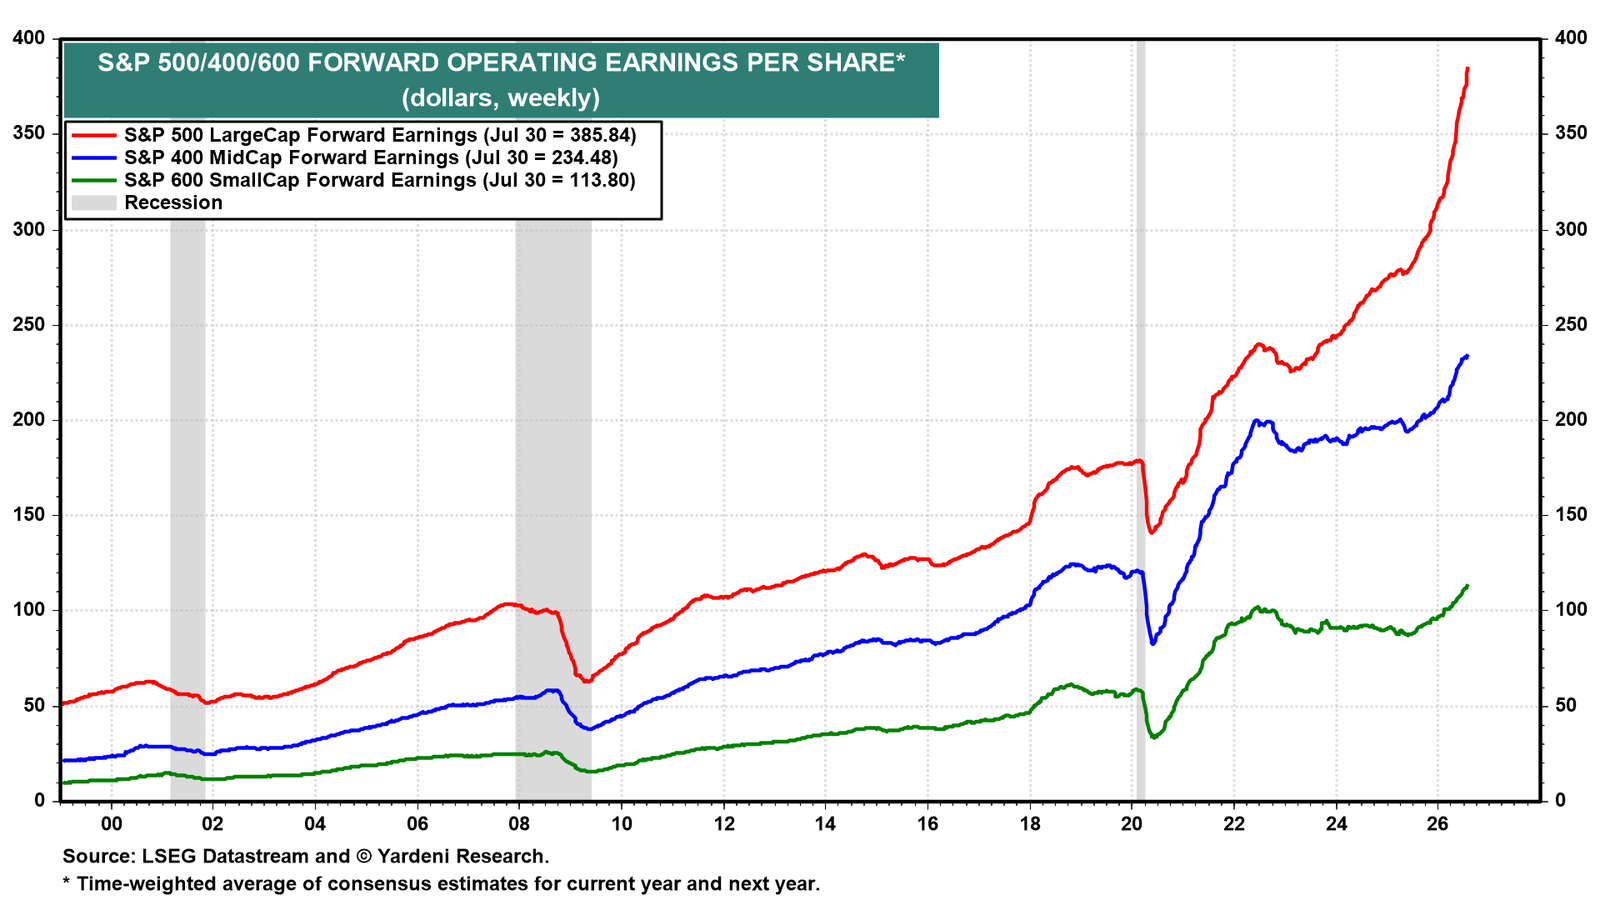
Forward earnings for the S&P 400 MidCaps and S&P 600 SmallCaps are rising along with the LargeCap forward earnings series (chart). The MidCaps and SmallCaps are not distorted by MTM.
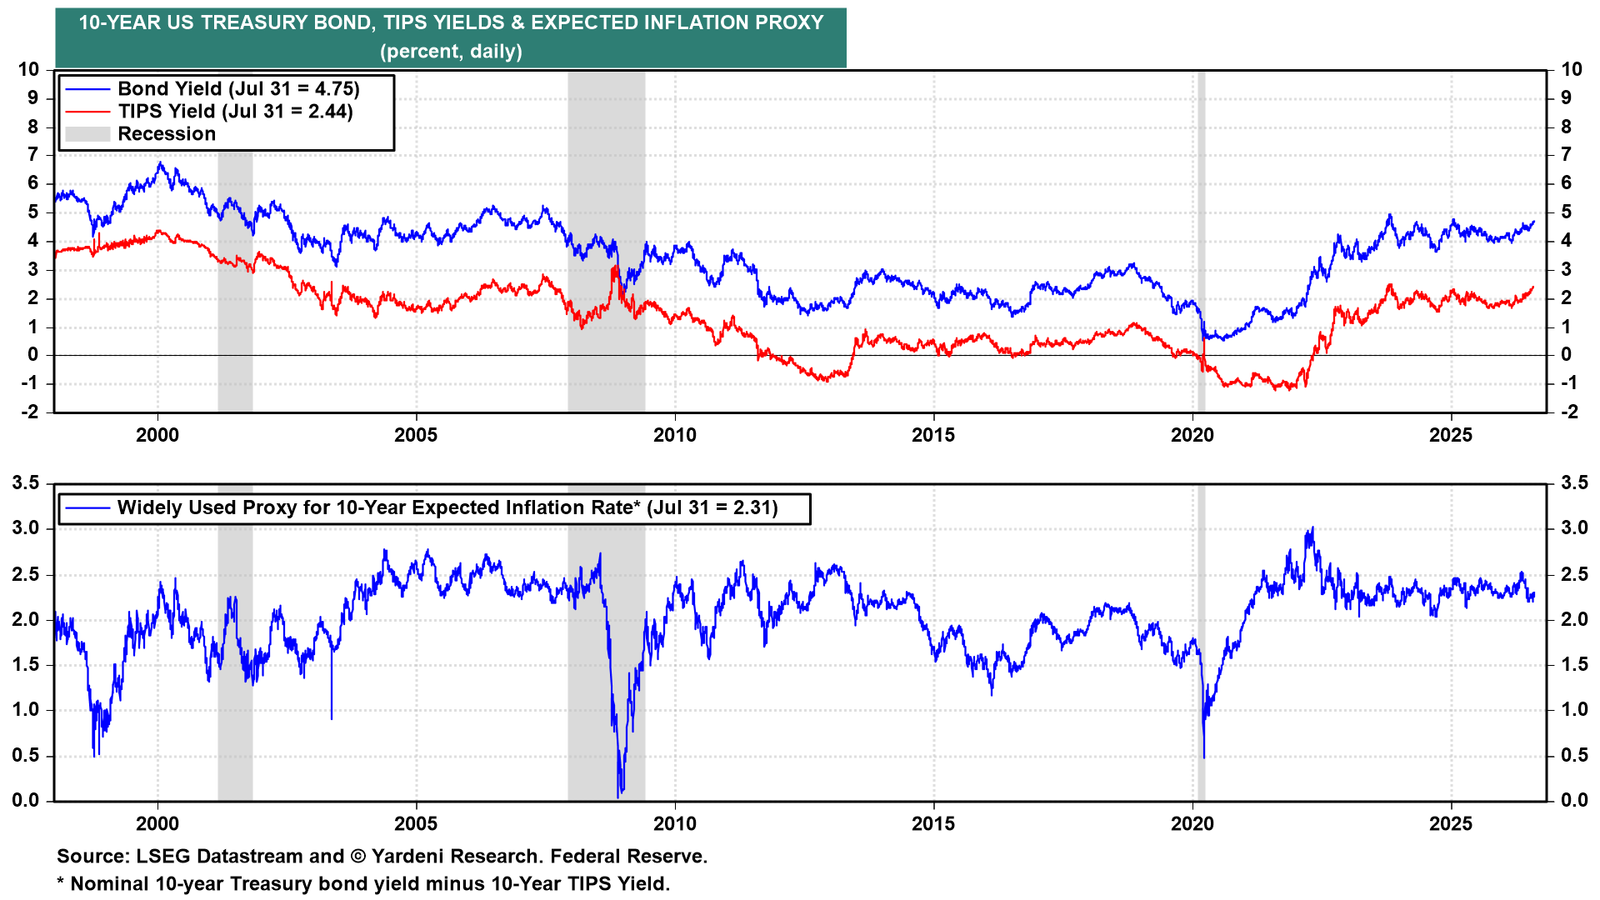
(5) Bonds. The Bond Vigilantes are not happy. The 10-year Treasury yield has climbed to its highest level since January 2025 and is near the top of our 4.00%-5.00% “old normal” range, and the inflation-adjusted TIPS yield has risen with it (chart). Expected inflation has stayed contained. Stocks are absorbing higher yields well so far.
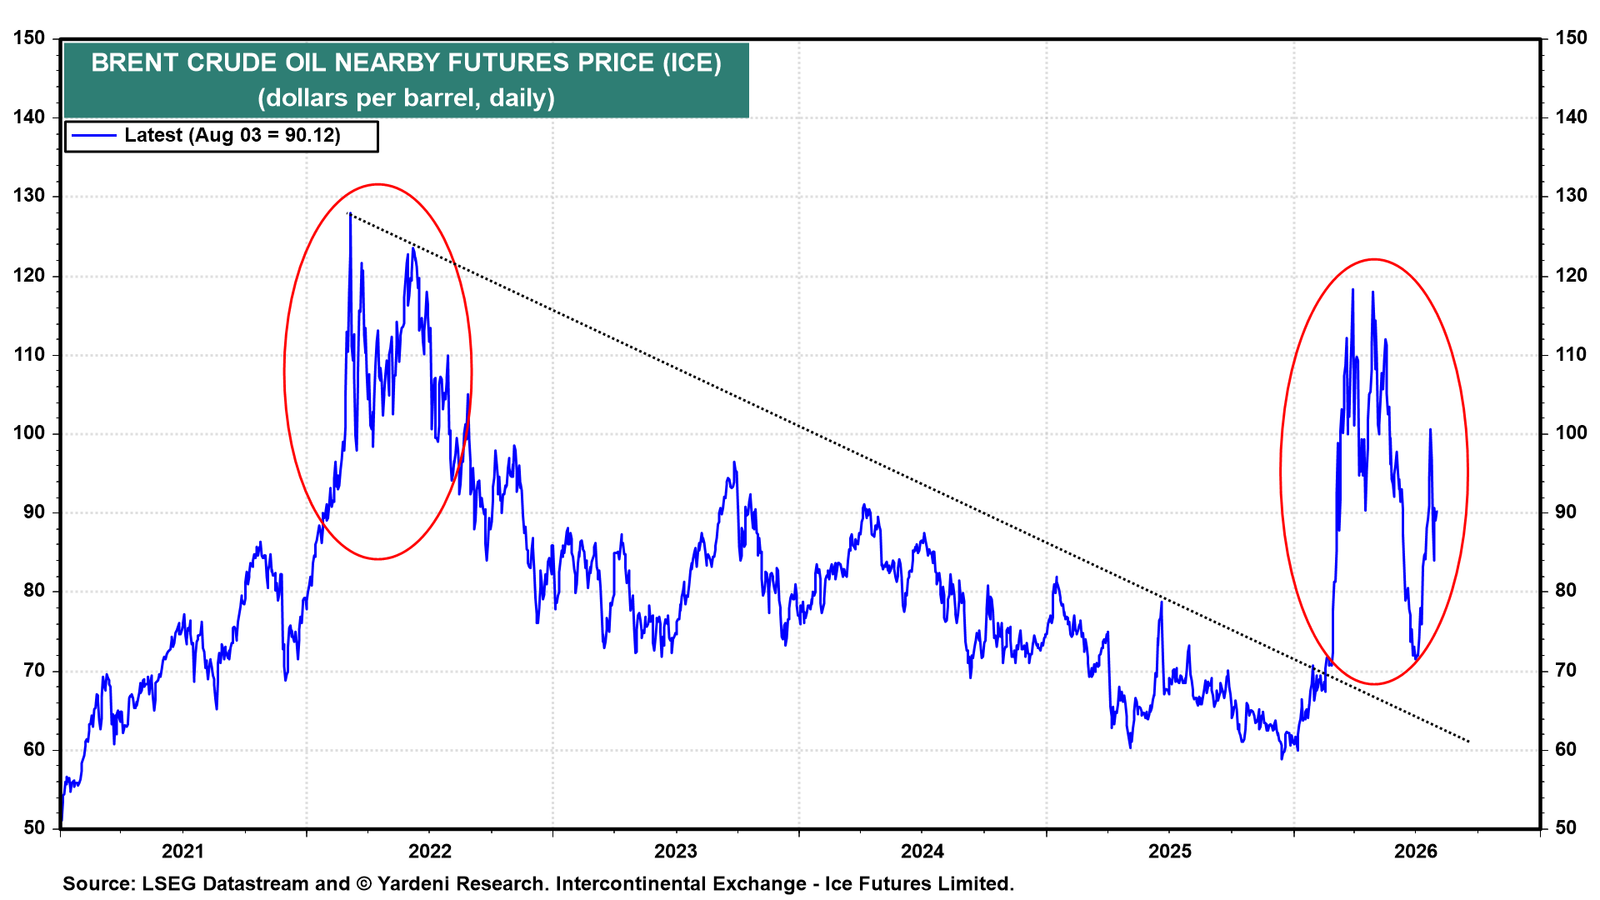
(6) Commodities. The stock market continues to tune out volatility in crude oil prices (chart). The price of a barrel of Brent crude is currently in the middle of its wide (and wild) range since the war started (chart).
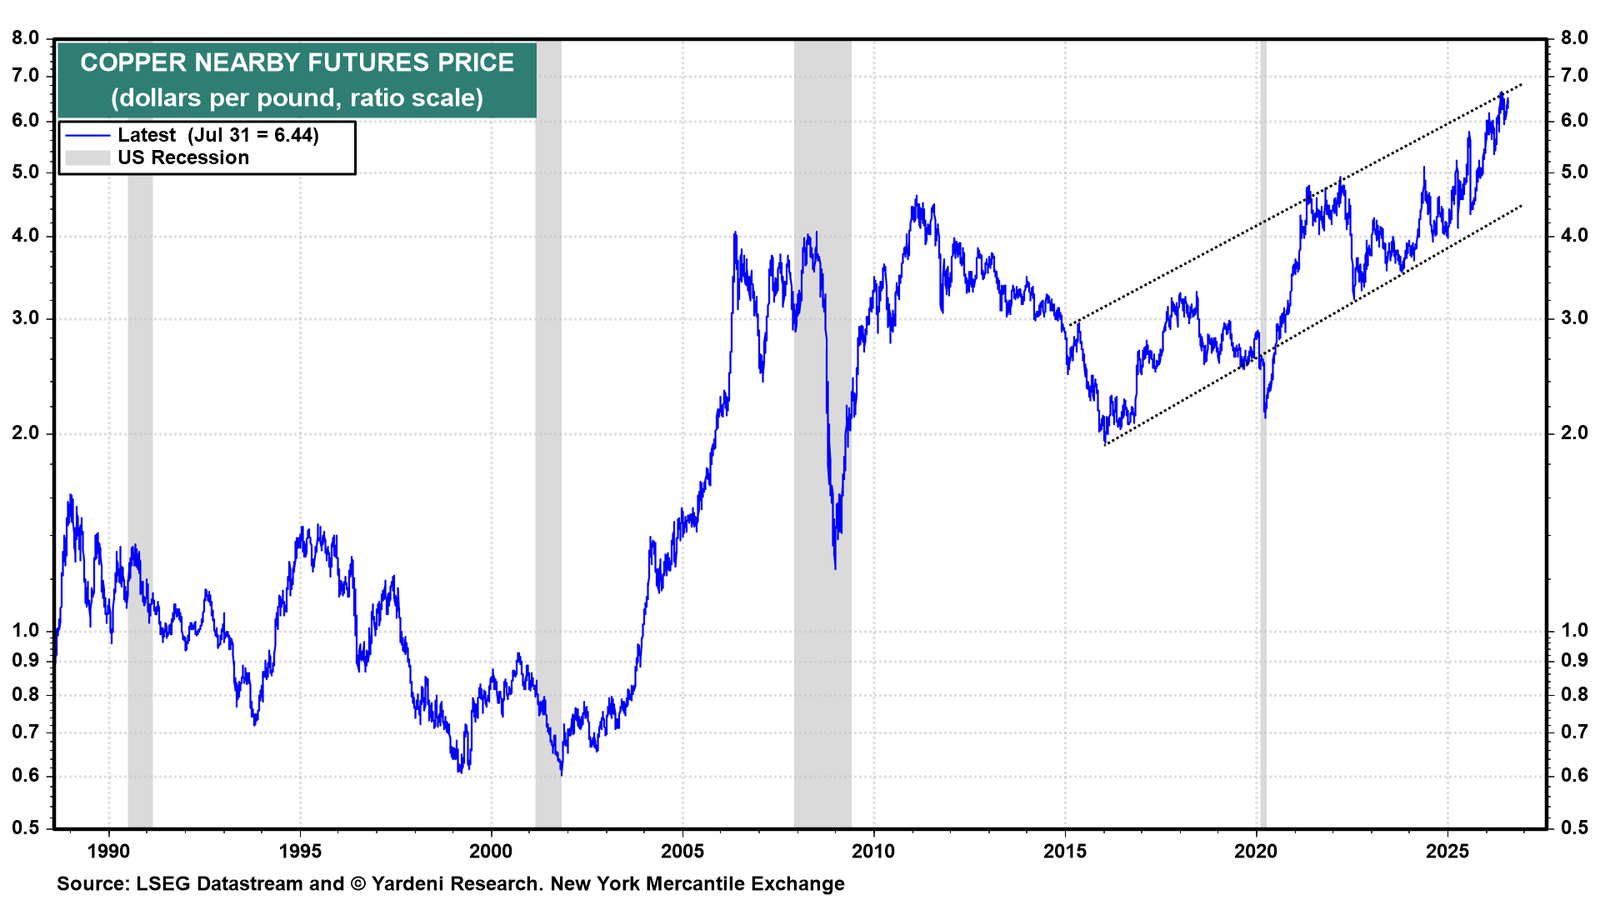
Copper is signaling that the global economy is growing and that AI infrastructure demand for the metal remains strong. It is currently pressing the top of its multi-year upward trending channel (chart).
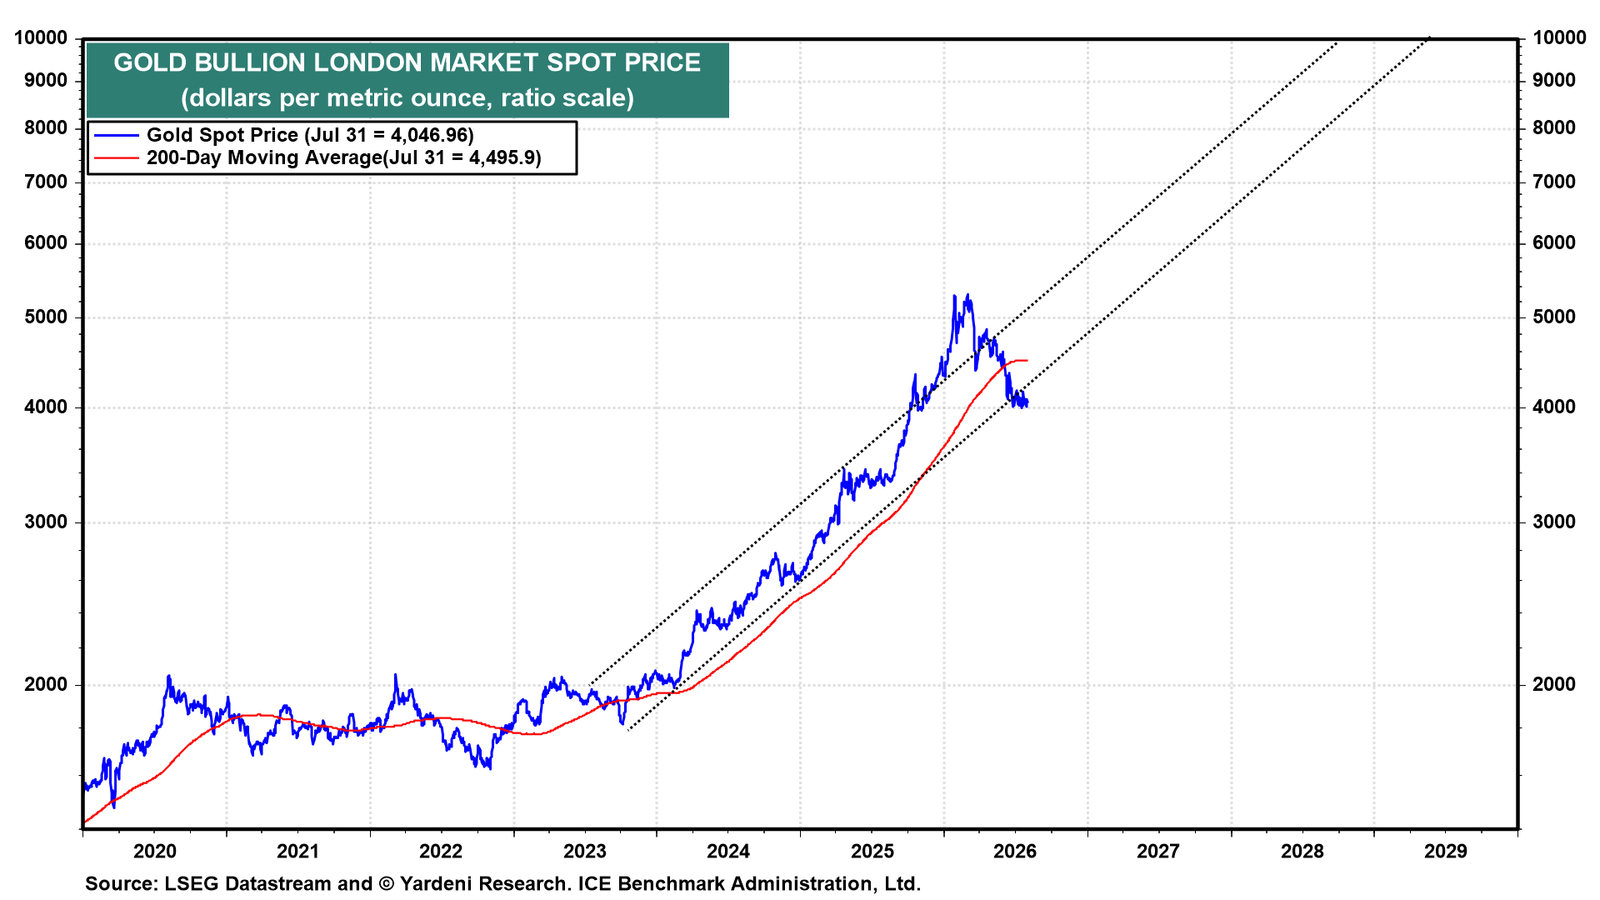
The gold price has broken below its channel and is holding just above $4,000 per ounce (chart). We see support at $4,000 and think it will stay above that level. If it does, then $5,000 is still possible by the end of the year. If it does not, then $3,500 is the next level of support.
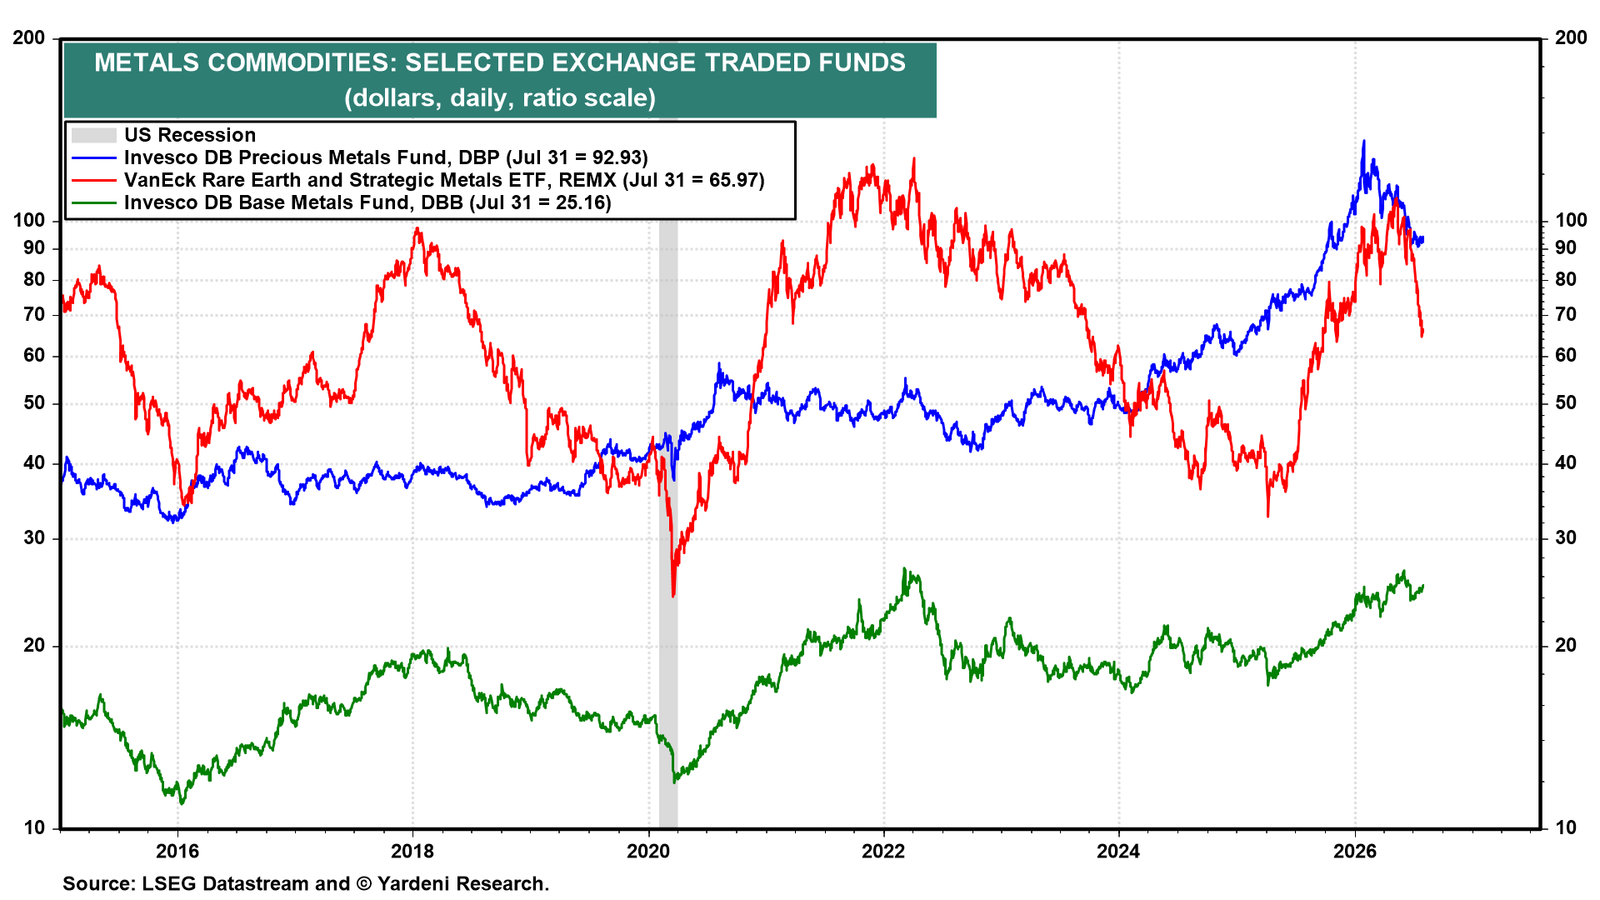
Rare earths have taken a dive on no obvious news (chart). They’ve fallen faster than precious metals, while base metals remain on an uptrend.
💡
Join the discussion with Ed below! To leave comments or questions, log in to the Yardeni QuickTakes website and post them at the end of the QuickTakes article. Paid members’ contributions may be featured in our segment, “Ed Answers Your Questions”.