Yale economics professor Robert Shiller developed one of the best stock market valuation metrics ever — the cyclically adjusted price-to-earnings (CAPE) ratio. This ratio measures overall market price-to-earnings multiples, but with a twist. Instead of only looking at earnings over the last four quarters, it uses a 10-year moving average of inflation-adjusted earnings.
Shiller has analyzed U.S. stock market CAPE ratios going back to 1871. That date is well before the creation of the S&P 500 (SNPINDEX:^GSPC) in 1957. However, the widely followed index and Shiller’s valuation metric have become intertwined, resulting in the S&P 500 Shiller CAPE ratio.
Missed Nvidia in 2009? This Rare Signal Is Flashing Again. In 2009, a “Double Down” signal flashed for a little-known chipmaker called Nvidia. For the first time in years, that same “Total Conviction” signal is flashing for a company 1/100th the size of Nvidia. Continue »
I give you this history as background to introduce a recent development. The S&P 500 — and more specifically, the S&P 500 Shiller CAPE ratio — just did something seen only one other time since 1871. And it’s not good news for Wall Street.

Image source: Getty Images
40 is a rare number
The S&P 500 Shiller CAPE ratio has remained below 25 throughout most of the U.S. stock market history. From 1871 through 2000, the valuation metric averaged roughly 15.7.
However, the CAPE ratio has spiked occasionally. When stock prices rose sharply, the gap between the S&P 500’s valuation and 10-year earnings moving average widened.
Shiller’s indicator didn’t breach 30 until 1929. After retreating, though, it stayed below that threshold for nearly seven decades. However, in early 1999, the S&P 500 Shiller CAPE ratio did something unprecedented: It topped 40. Later that year, the metric rose above 41 for the first time. With only a brief dip below the mark, the CAPE ratio stayed at this elevated level until October 2000.
More than two decades passed, with Shiller’s valuation metric never rising above 40 — until recently. In June 2026, the S&P 500 CAPE ratio hit 40 for the second time in 155 years.
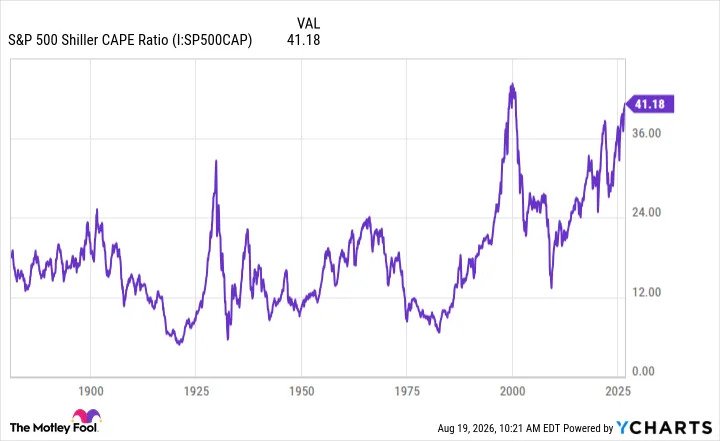
S&P 500 Shiller CAPE Ratio data by YCharts
An ominous historical precedent
The S&P 500 Shiller CAPE ratio topping 40 isn’t just rare; it’s also ominous. At least, that’s what history shows.
Sharp increases in the valuation metric have almost always been a worrisome sign for investors. For example, shortly after the CAPE ratio rose above 30 in 1929, the stock market crashed, and the Great Depression began.
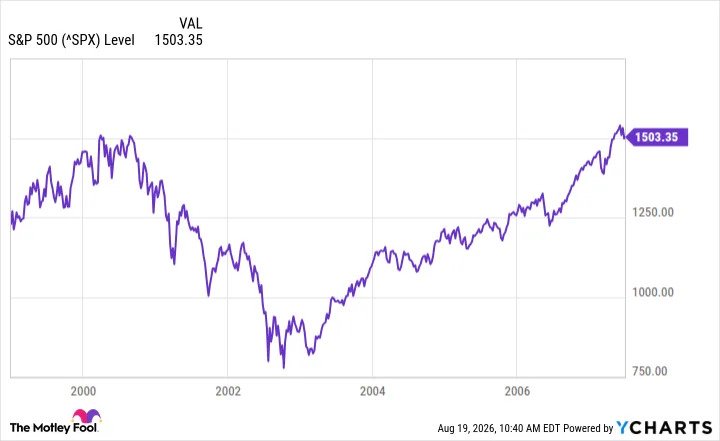
You might remember what happened the last time the S&P 500 Shiller CAPE ratio crossed 40 in 1999. It remained high for a while, then the bottom fell out. The dot-com bubble burst, with the S&P 500 eventually falling more than 45% below its peak. It took nearly seven years for the index to recover fully.
Invesco (NYSE:IVZ) analyzed historical stock market returns during periods following elevated CAPE ratios. The asset manager found that the S&P 500 has delivered negative annualized returns over the next decade when the CAPE ratio surges to frothy levels.
The S&P 500 CAPE ratio has a track record of reversion to its mean. There are only two ways this reversion can occur: Either the S&P 500’s valuation declines, or earnings increase significantly. The former is much easier than the latter.
What should investors do?
Investors today shouldn’t panic, though. For one thing, this time may be different from the past. The S&P 500’s earnings are rising faster than valuations. That wasn’t the case during the dot-com bubble, when many publicly traded companies were losing money hand over fist.
However, a historically high S&P 500 Shiller CAPE ratio shouldn’t be ignored. It could be an omen of negative stock market returns in the near future, just as it has been in the past.
The smartest strategy for investors is to focus on the stocks of high-quality businesses with strong long-term growth prospects and reasonable valuations relative to this growth. Building cash could also be a prudent move to be able to take advantage of a steep market sell-off if one occurs.
This is the approach that Warren Buffett is taking, by the way. And he knows a thing or two about reading the tea leaves with the stock market.
Should you buy stock in S&P 500 Index right now?
Before you buy stock in S&P 500 Index, consider this:
The Motley Fool Stock Advisor analyst team just identified what they believe are the 10 best stocks for investors to buy now… and S&P 500 Index wasn’t one of them. The 10 stocks that made the cut are built for long-term growth and could produce monster returns in the coming years.
Consider when Netflix made this list on December 17, 2004… if you invested $1,000 at the time of our recommendation, you’d have $429,223!* Or when Nvidia made this list on April 15, 2005… if you invested $1,000 at the time of our recommendation, you’d have $1,318,055!*
That performance is why people listen. With a track record of beating the S&P 500 by nearly 5x, Stock Advisor offers a distinct advantage. Don’t miss the latest top 10 list, available with Stock Advisor, and join an investing community built for the long haul.
*Stock Advisor returns as of August 23, 2026.
Keith Speights has no position in any of the stocks mentioned. The Motley Fool has no position in any of the stocks mentioned. The Motley Fool has a disclosure policy.
The S&P 500 Just Did Something Seen Only 1 Other Time Since 1871 — and It’s Not Good News for Wall Street was originally published by The Motley Fool