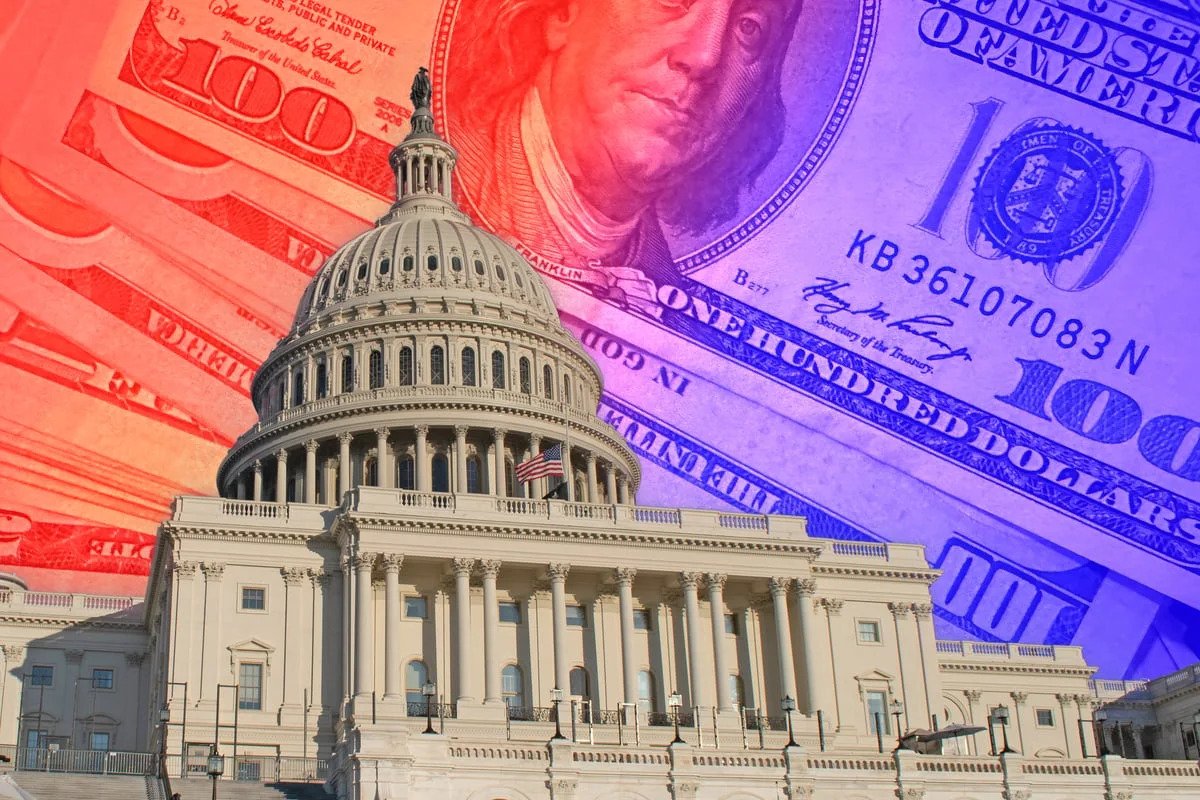
Milestones are usually meant to be celebrated, but this achievement isn’t necessarily a positive development. The U.S. government’s debt balance has officially exceeded $40 trillion. This massive sum is equal to 124% of the country’s gross domestic product (GDP), up from a 62% share in 2006.
What’s more, the federal debt burden has more than doubled in a decade. Compared to 20 years ago, it has exploded 376% higher. Within the U.S. budget, more money goes to interest payments now than it does to anything else, except Social Security and Medicare.
Here’s what history says all of this borrowing means for the stock market. Investors will want to pay attention.

Image source: Getty Images.
The U.S. has a spending problem
When President Donald Trump began his second term, he immediately set up the Department of Government Efficiency. This agency, headed by Elon Musk, was tasked with cutting spending and reducing the deficit. But by any measure, it was a complete failure. Even the world’s most prominent tech visionary couldn’t make a tiny dent in fixing the country’s finances.
This gets to the heart of the situation. It doesn’t matter what side of the political aisle you stand on. The U.S. has a spending problem, with the national deficit through 10 months of fiscal 2026 totaling $1.8 trillion.
The spending spree totally makes sense in desperate times. During the Great Recession or the COVID-19 pandemic, which brought the global economy to a halt, the government enacted stimulus measures to get things back on track. However, the debt figure keeps climbing even when we’re not in a recessionary period.
There is no end in sight. The Congressional Budget Office expects gross federal debt to reach $64 trillion by 2036. This could end up being a conservative view. The higher the debt becomes, the more interest the country has to pay. Consequently, this unfavorable setup then supports borrowing more money to service existing obligations. It’s like a person signing up for a new credit card to pay the bill on an old one.
That $40 trillion figure reflects the level of trust that holders of U.S. Treasuries have in the economy and financial system. The U.S. has the global reserve currency, the world’s dominant economy, and the most robust capital markets. This means borrowing and spending can continue longer than people expect.
Today’s Change
Index Level
7,674.37
Investors should be bullish
For investors, this suggests that equity valuations matter less because so much money is being pumped into the economy, distorting market dynamics. Pressure mounts on the Federal Reserve to lower the fed funds rate to make interest payments more manageable. There is a higher chance the central bank will monetize the debt. These are accommodative measures used to pump liquidity into the system.
The result is ongoing currency debasement. In the past decade, the U.S. M2 money supply has grown by 81%, and the dollar’s purchasing power has declined by 28% in that time. Consumers worry about sticky inflation.
However, inflationary pressures also find their way into investable asset classes. The stock market has benefited.
Exactly 10 years ago, the S&P 500 index (^GSPC +0.43%) traded at a CAPE ratio of 26.7. What appeared to be a historically elevated valuation at that time didn’t prevent the benchmark from proceeding to generate a total return of 317% over the last decade (as of Aug. 20). Another strong performance could occur.
Right now, the S&P 500 index carries a CAPE ratio of 42.2. In theory, this should be a recipe for poor returns in the coming decade. However, the U.S. government’s fiscal mismanagement is perhaps the most powerful tailwind driving the market.
Investors should be bullish.