Quick Summary
- Every midterm cycle since 1962 saw a market decline between mid-August and Election Day. On average, the drop was 8.1 percent, and 10 out of 16 cycles hit their lowest point in October.
- On average, the market gained 12.4 percent in the 12 months after midterms.
- Many investors believe this time is different because of all the bad news. However, markets tend to react more to “better or worse” than “good or bad.”
- The last six years brought plenty of scary headlines, but also a lot of wealth creation.
If the market gets bumpy in the next eight weeks, keep in mind that this is normal, not a sign of disaster. The weeks before a U.S. midterm election are usually some of the least rewarding for stocks. But once the votes are in, the market has often done much better.
This does not mean stocks will definitely fall before November 3, 2026, or rise right after. History does not follow a set schedule. Still, it helps to remember that uncertainty often builds before midterms, and markets usually improve once that uncertainty is gone.
This pattern is harder to believe when the news looks especially bad. Every election cycle brings new reasons to think things will change. This year, investors are dealing with war in the Middle East, ongoing inflation, high oil prices, tariffs, rising Treasury yields, large federal deficits, high stock valuations, concerns about an artificial intelligence bubble, and a close political race. That is a lot to process.
But markets don’t need everything to go perfectly; they just need results to be better than expected and for businesses to keep making money. Markets tend to react more to “better or worse” than “good or bad.”
Midterm years usually see the stock market take a hit.
U.S. Bank studied market data through 2025, covering 31 midterm elections since 1900. In the 12 months before those elections, the S&P 500 stock market index returned an average of 2.9 percent, much lower than the 8.9 percent average for all years in the study. Still, the research found that this difference was not strong enough to be used as a reliable trading rule. Why? The weak years weren’t only because of elections. Events like the Great Depression, wars, stagflation, financial stress, inflation shocks, and aggressive Federal Reserve actions caused most of the trouble.
Even so, this pattern has happened often enough to notice. Research from U.S. Global Investors found that every midterm cycle since 1962 saw a decline between mid-August and Election Day. On average, the S&P 500 dropped 8.1 percent, and 10 out of 16 cycles hit their lowest point in October. Midterm years have also seen bigger drops during the year, even if the full year turned out fine.
If stocks fall by five percent, eight percent, or 10 percent this fall, people will find scary reasons to explain it. Some of those reasons might be true. But the drop itself would not be unusual. It is actually one of the most common things the market does during this part of the political cycle. This information can help you plan how to respond if it happens.
Then the calendar flips.
A stronger trend usually starts after Election Day. U.S. Bank’s 125-year study found that, on average, the market gained 12.4 percent in the 12 months after midterms. Capital Group, using data since 1950, found an average one-year return of 15.4 percent after midterms, which is about twice as much as in other years. In that post-1950 sample, every one-year period after a midterm was positive.
The next year is also the third year of the four-year presidential cycle. According to annual total-return data from New York University, the S&P 500 averaged about 20.0 percent in the 20 third-year periods from 1947 to 2023. All 20 years were positive. The median gain was about 22.5 percent, compared to an average of roughly 12.6 percent for all years in the same period.
I would not plan for retirement expecting a 20 percent return in 2027. The sample size is small, valuations matter, and the usual reason that presidents boost the economy before running for reelection does not apply as much when the current president cannot run again. Stocks may gain less than the historical average in this third-year.
But consider what happened during the toughest postwar third-years. Even after the 1987 crash, the S&P 500 ended up 5.8 percent for the year. When the financial crisis started in 2007, stocks still finished up 5.5 percent. In 2011, after the U.S. credit-rating downgrade and European debt crisis, the index managed a 2.1 percent gain. The 2015 earnings recession, oil collapse, and China scare led to a 1.4 percent gain. Those years felt terrible, but their full-year returns were closer to flat than disastrous.
Many investors say that this time is different—it’s worse—because today’s list of risks is longer and more significant. I am not sure it really is either: I think it just feels that way because it’s in the headlines.
Let’s look back and try to remember what we have been concerned about over the last six-plus years. In 2020, we had a global pandemic, forced shutdowns, a 34 percent stock market crash, and the deepest economic contraction in generations. Then came supply-chain breakdowns, labor shortages, and inflation that reached 9.1 percent, the highest in roughly 40 years. The Federal Reserve responded with its fastest rate-hiking campaign in decades. Russia invaded Ukraine. Hamas attacked Israel, war spread across the region, and the Strait of Hormuz became a global economic concern. Silicon Valley Bank and other regional banks failed. Economists spent years predicting recessions. Washington delivered debt-ceiling fights, shutdowns, tariff shocks, and constant questions about Federal Reserve independence.
Investors also worried that the S&P 500 relied on too few big companies, that artificial intelligence was a bubble, that spending on data centers would not pay off, and that stock prices were too high to support future returns. Some of these concerns are still valid. None of them stopped the market from creating a lot of wealth, even trading at highs recently.
On a calendar-year basis, 2020 through 2025 delivered about 130 percent, according to data from Robert Shiller. From the start of 2020 through July 2026, $100 invested in an S&P 500 index portfolio with dividends reinvested grew to roughly $255 (a gain of about 155 percent).
Measured from the pandemic low on March 23, 2020, through August 21, 2026, the S&P 500 price index rose about 243 percent. You have to go back to the late-1990s boom to find a comparable six-year-plus price surge.
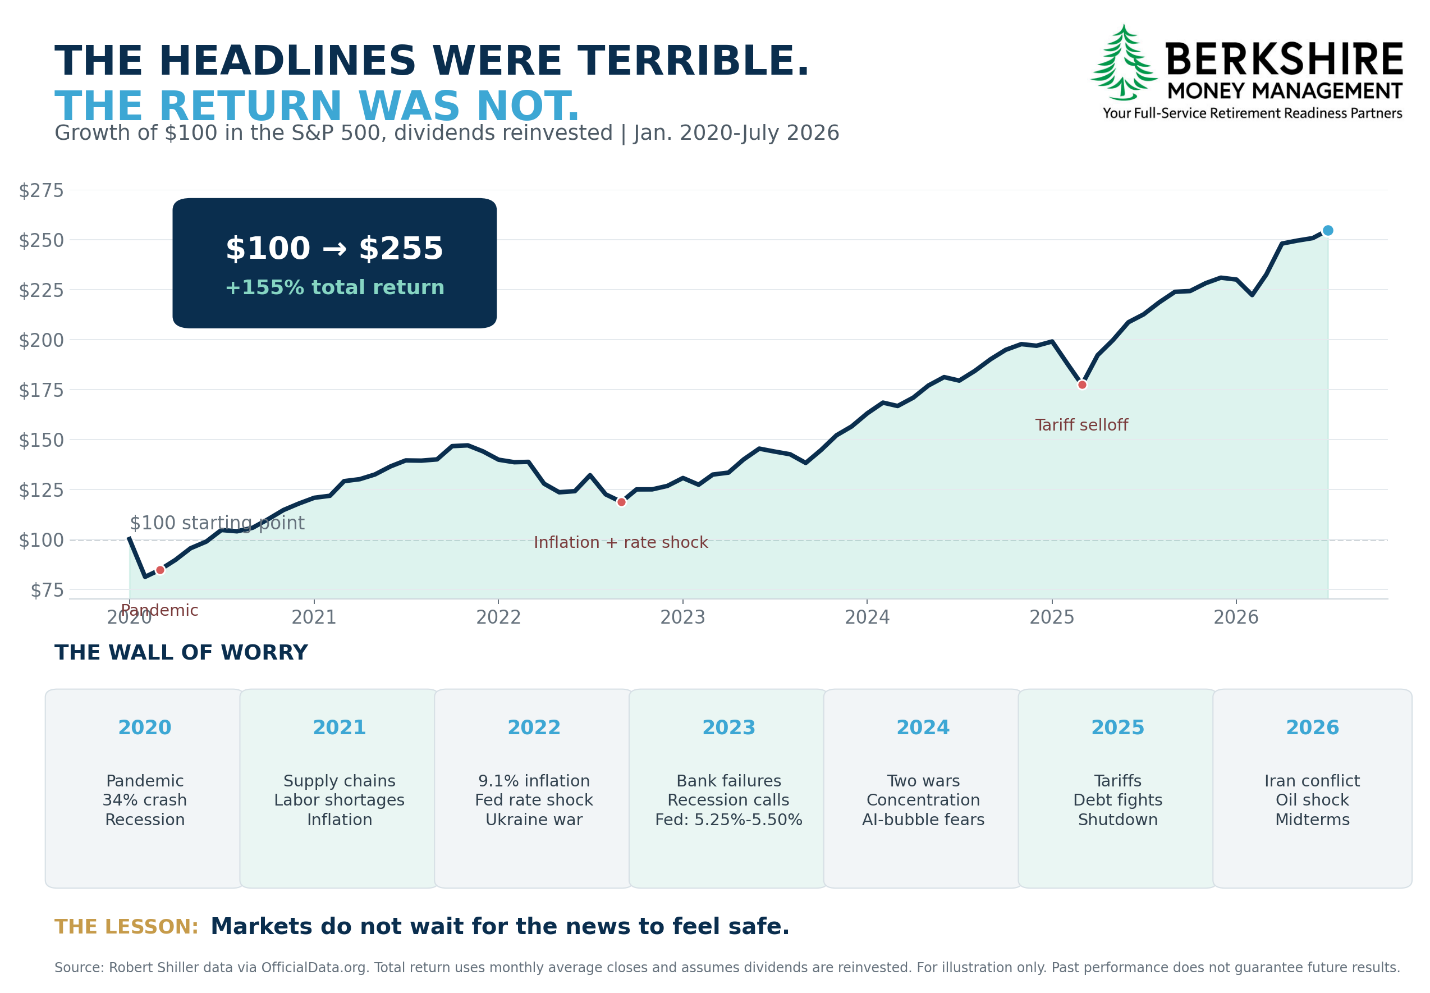
The last six years brought plenty of scary headlines, but also a lot of wealth creation. This is where investors often get stuck. They make a list of everything that could go wrong, give each item a chance of happening, and decide the market must fall. The math seems logical, but it ignores how people and companies adapt. Businesses raise prices, change suppliers, cut costs, invent products, find new financing, and move production. Consumers adjust. Governments respond. Markets often change before the headlines improve because, as cited previously, stock prices respond less to good or bad news and more to improving or worsening trends. The S&P 500 is up just about double-digit percentage points year-to-date; it is not ignoring the Iran conflict, energy prices, tariffs, deficits, or inflation. It is weighing those risks against profits, productivity, investment, and the chance that things could get better.
A truly terrible year for the stock market usually takes more than just an election. It often needs a deep recession, a financial crisis, a policy mistake, or a big geopolitical shock that hurts earnings and credit at the same time. These things do happen, but they are rare. In U.S. Bank’s 31-midterm sample, 11 elections happened alongside major economic or geopolitical problems, and those outside forces explained the worst results better than politics did.
The optimistic view doesn’t require everything to be perfect, but it can help to ask, “What could go right?” The election could clear up some policy uncertainty. Energy prices could fall. Trade talks could ease the impact of tariffs. Spending on artificial intelligence could lead to real productivity gains. Market leadership could spread to smaller companies and older industries. Earnings estimates could go up. None of these outcomes is guaranteed, but neither is the disaster that investors can describe in more fearful detail.
The lesson is not to buy stocks just because it is a midterm year. The real lesson is to avoid selling stocks at the wrong time just because the calendar and the headlines make you uneasy. History shows that the months before midterm elections can be rough for the markets. It also shows that the 12 months after midterms, especially the third presidential year, have rewarded patience more than usual. Maybe 2027 will not give us 15 percent or 20 percent returns. Maybe it will just be OK, or flat. But investors already spend plenty of time asking, “What could go wrong?” The balance of risk is favorable enough for me to keep holding my equity positions.
Allen Harris is an owner of Berkshire Money Management in Great Barrington, Dalton, and Williamstown, managing more than $1 billion of investments. Unless specifically identified as original research or data gathering, some or all of the data cited is attributable to third-party sources. Unless stated otherwise, any mention of specific securities or investments is for illustrative purposes only. Advisor’s clients may or may not hold the securities discussed in their portfolios. Advisor makes no representation that any of the securities discussed have been or will be profitable. Full disclosures here. Direct inquiries to Allen at [email protected]. Past performance and historical market patterns are not indicative of future results. Historical averages are provided for informational purposes only and should not be interpreted as a prediction of future market performance. Index returns are unmanaged, assume reinvestment of dividends where indicated, and do not reflect fees, expenses, or taxes. Investors cannot invest directly in an index. This commentary is provided for informational and educational purposes only and should not be construed as personalized investment advice or a recommendation to buy, sell, or hold any security or pursue any particular investment strategy. Investment decisions should be based on each investor’s individual objectives, financial circumstances, risk tolerance, and other relevant considerations.