by Donald Gould
Today’s stock market looks expensive by historical standards. By expensive, we are not talking about the price of stocks, but rather their value — how much we pay for a dollar of corporate earnings, or profits. That measure is called the price-to-earnings, or P/E ratio.
Divide Microsoft’s stock price of $510 by its earnings-per-share of $18 and you get a P/E ratio of 28. Do this for every stock and you can calculate the whole market’s P/E ratio. The accompanying chart shows that today’s market P/E is near its all-time high reached in 2000.
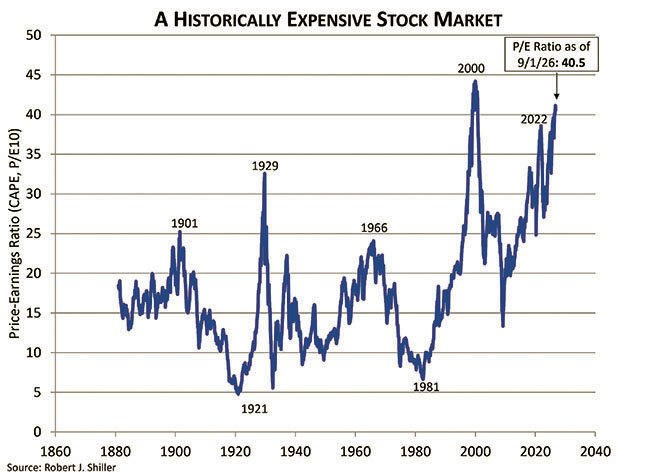
Today’s stock market: fairly priced, or in a bubble?
There are two main schools of thought on why stocks might look expensive right now. The “efficient market hypothesis,” or EMH, argues that prices fairly reflect all information available in the moment. If P/E ratios are historically high, EMH says there must be a good reason. As an example, today’s high P/E ratios might reflect a consensus that AI will accelerate corporate profit growth by increasing efficiency or creating whole new categories of economic activity. The expectation of increased future earnings would justify a higher P/E than before. Bolstering the case for EMH is the lightning speed with which information now moves around the globe and is digested by markets.
The second school focuses on the “animal spirits” that often dominate investor behavior. British economist John Maynard Keynes coined that term to describe how mass psychology periodically drives markets sharply above or below any reasonable measure of their true value. Bouts of widespread euphoria can lead to bubbles in markets for stocks, real estate, and other assets. A storied example: At the peak of the Dutch tulip bulb craze of the 1600s, a single bulb reportedly fetched 10 times the annual wage of a skilled craftsman. Likewise, extreme pessimism can color investors’ perceptions. After a decade of high inflation and poor stock market returns, a famous 1979 BusinessWeek cover declared the “death of equities.” Three years later, stocks turned sharply higher, a trend they’ve maintained for most of the past 44 years.
What should a stock market investor do?
If you subscribe to the EMH school, the long-term investor should not change course in response to today’s expensive market. Though the market looks expensive, it’s priced fairly and should deliver a return in line with its risk. So, instead of worrying about whether stocks are overpriced or a bargain (since EMH says they are neither), investors should keep their focus on asset allocation, making sure their portfolio is well diversified and properly reflects their tolerance for risk.
And if today’s prices reflect animal spirits more than logic? Market history is awash in bubbles. If you are over 40, you likely remember the dot-com mania of the late 1990s, when investor rapture over the world changing potential of the internet pushed the tech heavy Nasdaq index skyward by about 600% over a five-year period. The internet did indeed change the world, but investors wildly overestimated its impact on corporate profits. The Nasdaq peaked in March 2000 and then plunged nearly 80% over the next 19 months, giving back almost all its gains of the late 1990s. It was not until 2015 that the index recaptured its 2000 high point.
Today’s AI boom shares characteristics with the dot-com bubble, with companies (and their investors) committing trillions of dollars to AI infrastructure in a race with highly uncertain returns. There are important differences between the two periods as well. The public companies spending the largest amounts on AI are mostly established and solidly profitable businesses, which was not the case in the dot-com era. Will future earnings justify today’s lofty stock prices? We’ll only know in hindsight.
An investor who is convinced that prices are out of whack due to animal spirits might be tempted to try to time the market. This path is littered with pitfalls.
First, even if you know you’re in a bubble, you still have no idea how much bigger the bubble will get and how long it will take to peak. Suppose a crystal ball tells you that a 46% market drop will begin within five years. What do you do? If the market continues to barrel upward and peaks in three years at 86% above today’s level — about what the U.S. stock market has gained over the last three calendar years — a 46% drop will just bring the market back to today’s level. (The math: (100+86) x (100%-46%) ≈ 100.) Selling today will have gained very little; in fact, after capital gains taxes, your portfolio might be well below its starting position.
Several additional factors argue for staying the course even if you think investor emotions are distorting market prices. No one knows the timing or magnitude of the next bear market. We can’t identify an extended downturn until the market is long past its peak. And most won’t believe the market has reached its low point until a new uptrend is well established. The sobering upshot: it’s highly unlikely we’ll sell at the top or buy at the bottom.
The surprising conclusion … and one caveat
So, it turns out that if the simple objective is making money, it doesn’t matter much whether or not the market is priced correctly. If it’s priced correctly (per EMH), then there’s nothing to be gained from trading. And if it’s in a bubble, arguably the hazards of market timing more than offset any potential gains.
That said, there is still one argument in favor of reducing stock exposure in an overpriced market, and it has to do with risk. The most severe bear markets tend to be those that follow the biggest runups. If you’re convinced we’re in a bubble, trimming your stock allocation might help you sleep better at night, knowing that your portfolio will decline less when the bubble eventually pops. There is great value in a good night’s rest.
Don Gould is chairman and chief investment officer of financial advisory firm Gould Asset Management of Claremont.