Wall Street spent October selling chip stocks and buying toothpaste.
Consumer staples are headed for their best month in nearly five years as semiconductors crater, and the average S&P 500 stock is on track for its sharpest turnaround against the index in decades.
The AI sell-off has kept grinding through the companies leading the data center build-out, and the S&P 500 (^GSPC) has gone nowhere with it. Its equal-weighted version (^SPXEW), where the smallest company counts as much as Nvidia (NVDA), has pulled away.

Monday showed how fast that can flip. Chip stocks bounced, with 57 of 60 in a Yahoo Finance semiconductor basket rising, and the S&P 500 beat its equal-weighted twin.
It barely dented the month’s scoreboard.
The biggest comeback in more than 35 years
In September, the equal-weighted S&P 500 trailed the regular index by 4.5 percentage points. Through Monday, it’s beating it by about 4 points in October. That swing is on track to be the largest one-month reversal in favor of the average stock since at least 1990, according to Yahoo Finance calculations.
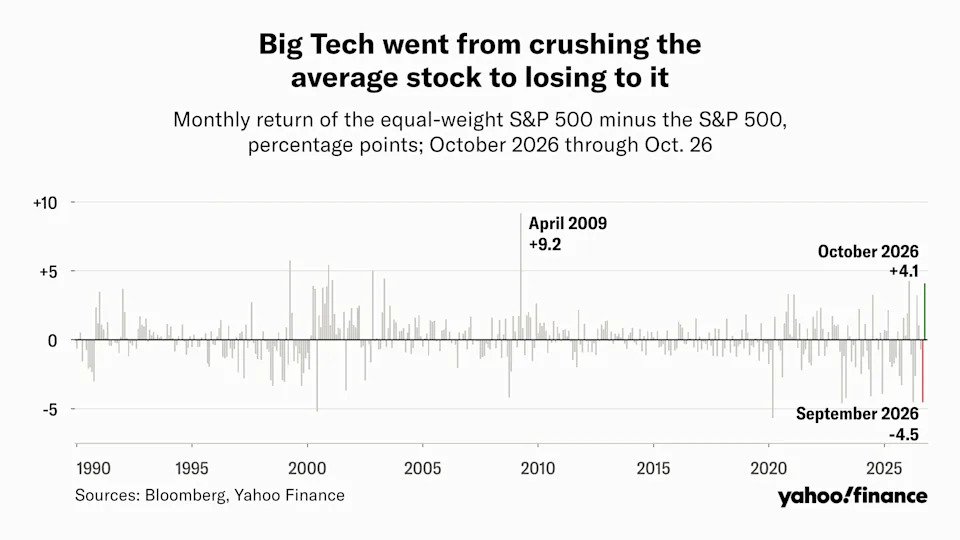
The pain is concentrated in chips. The PHLX Semiconductor Index (^SOX) is down about 12% this month even after Monday’s bounce. The money is going almost everywhere else, led by Energy (XLE), up 13%, and Staples (XLP), up 9%.
Ryan Detrick, chief market strategist at Carson Group, noted that pool, RV, and boat makers were among last week’s top groups.
Investors are swapping data centers for hot tubs.
That puts equal weight on track for its first winning year against the S&P 500 since 2022.
What the midterms say
So what’s an investor to do? History offers a clue, and it hasn’t been kind to years like this one.
Since 1950, midterm years have been the weakest stretch of the four-year presidential cycle, with a median S&P 500 gain of about 1%, according to Yahoo Finance calculations.
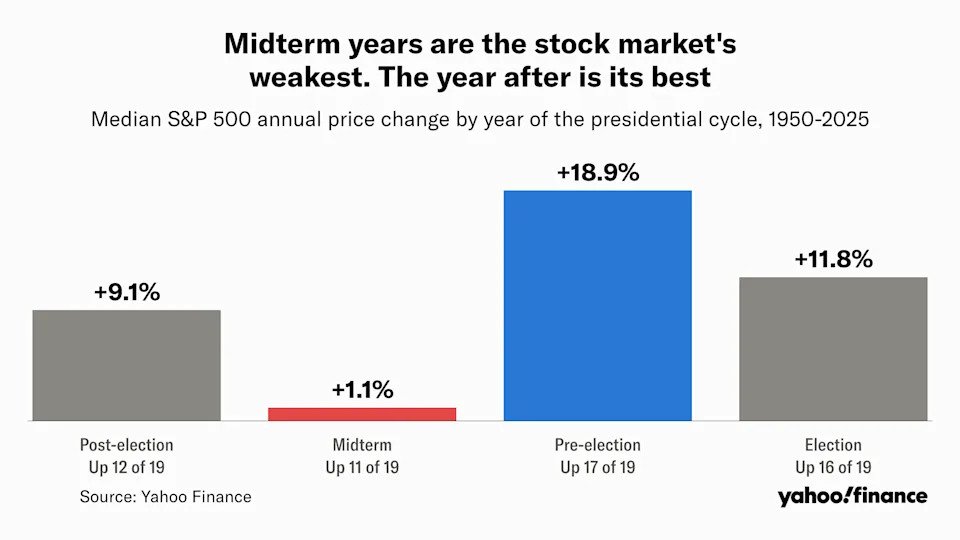
Detrick has pointed out that the bottom often comes right about now.
“Historically, you tend to see late October major lows in midterm years,” he wrote on X, citing near-record bets on further declines. On Friday, he added that “we could be looking at another late October buying period.”
Election Day is Nov. 3. The S&P 500 has been higher a year after every midterm since 1950, all 19 of them.
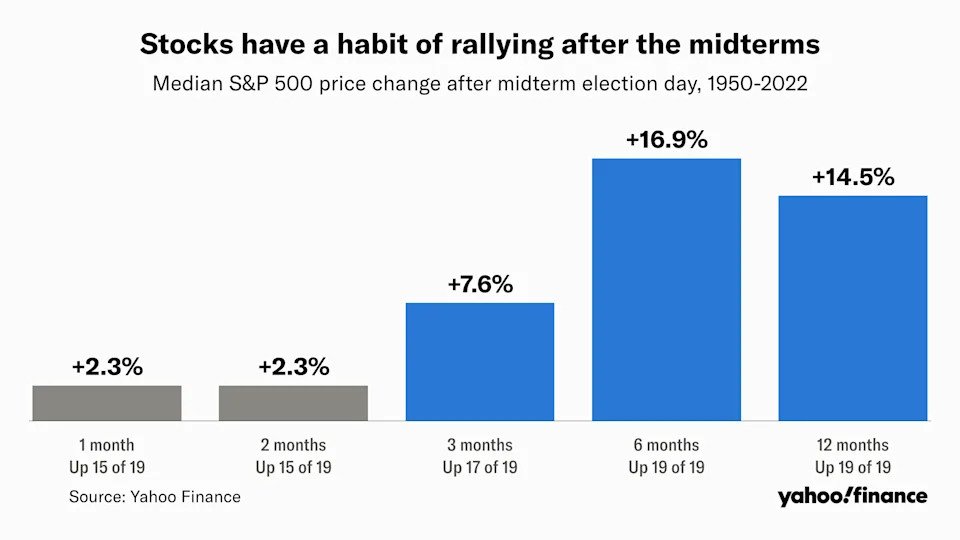
The payoff can take a while. In 2018, stocks kept falling after the vote, entered a bear market, and didn’t bottom until Christmas Eve. And 19 elections is a small sample, especially in a year when the AI trade that powered the rally is the one cracking.