A sharp, technology-led stock market rout following the U.S. midterm elections wiped trillions of dollars from American companies. However, its scale so far remains well short of the crashes that defined previous financial crises.
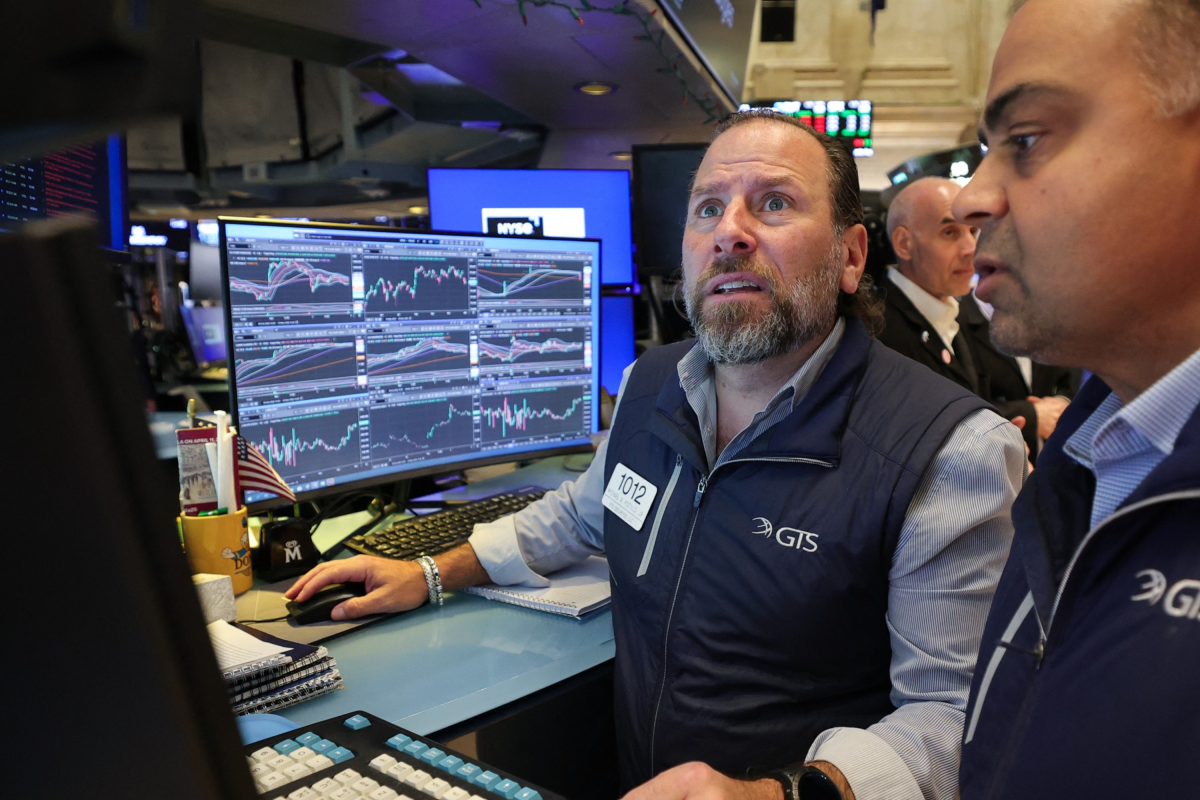
The Nasdaq Composite fell 5.52 percent on Thursday, November 5, entering correction territory at more than 10 percent below its October record.
The S&P 500 dropped 4.36 percent, the Dow Jones Industrial Average lost 3.44 percent and nearly $3 trillion was erased from the value of S&P 500 companies, according to Yahoo Finance.
Read More on News
It wiped an estimated $113 billion from tech billionaire Elon Musk’s paper wealth over two days as shares in Tesla and SpaceX fell, according to the Bloomberg Billionaires Index.
Despite the decline, Musk remained the world’s richest person, with an estimated fortune of $785 billion.
President Donald Trump responded by blaming Americans for how they voted in the elections, posting on his Truth Social platform: “The Stock Market crashed today because the Dumocrats had a big Tuesday — So sad to see, you only have yourselves to blame!”
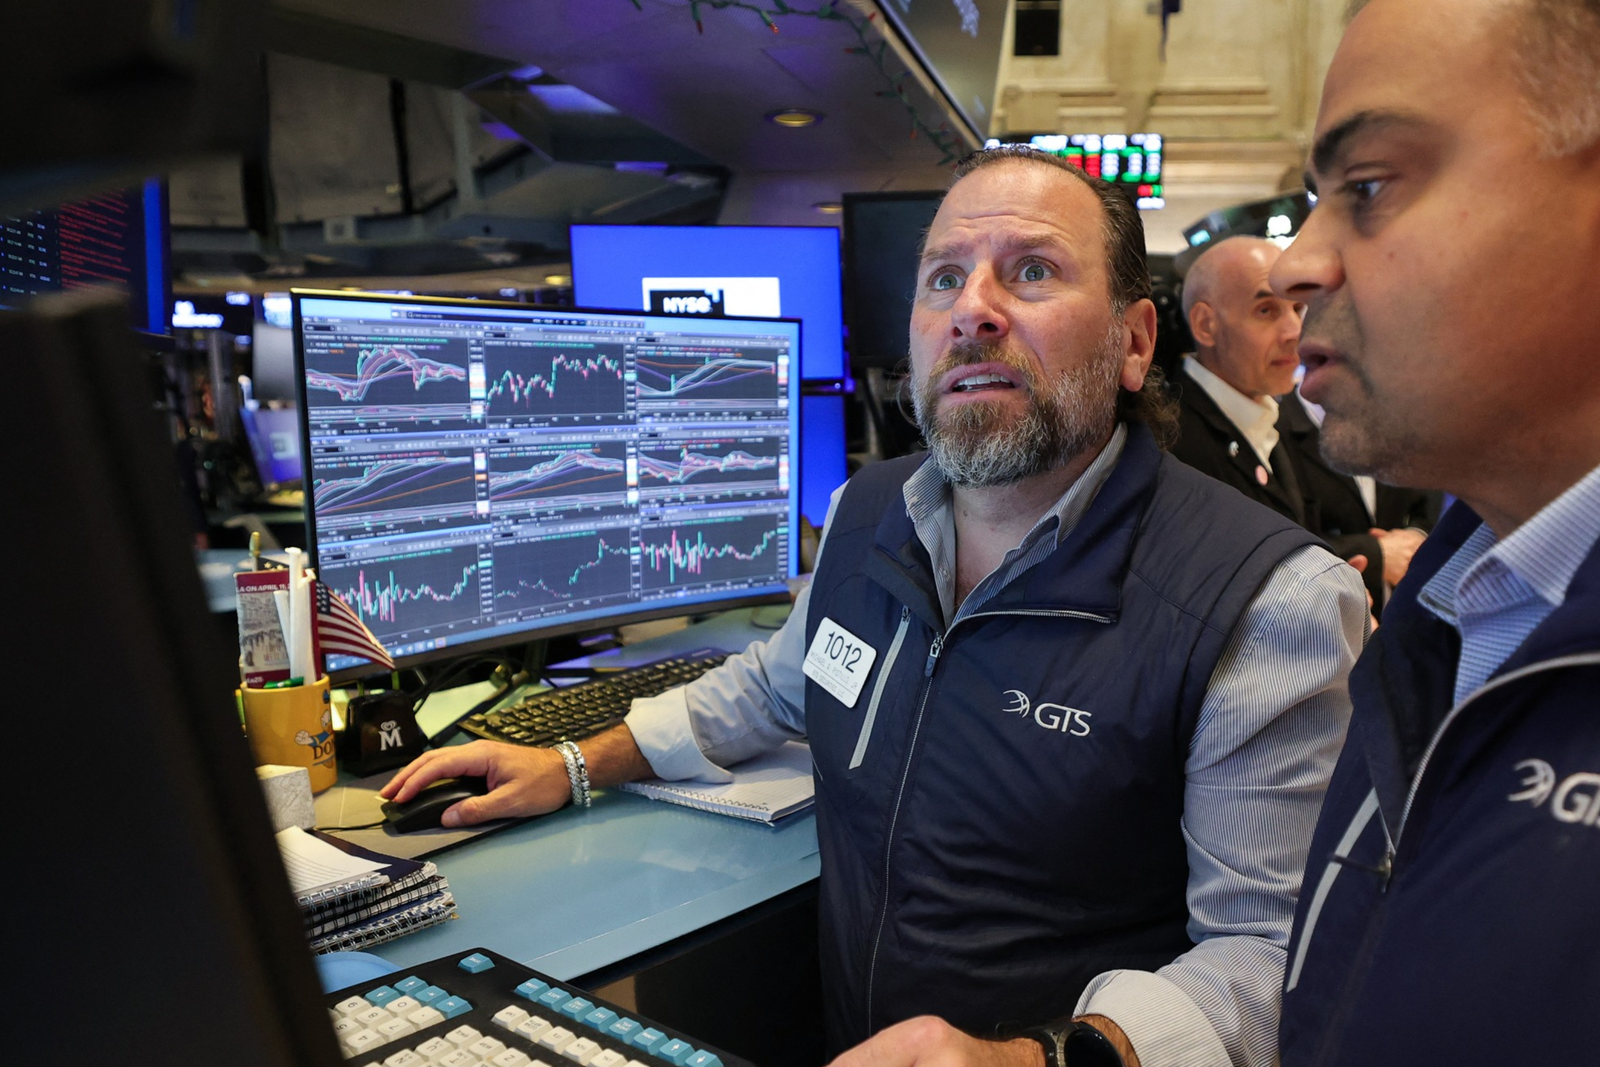
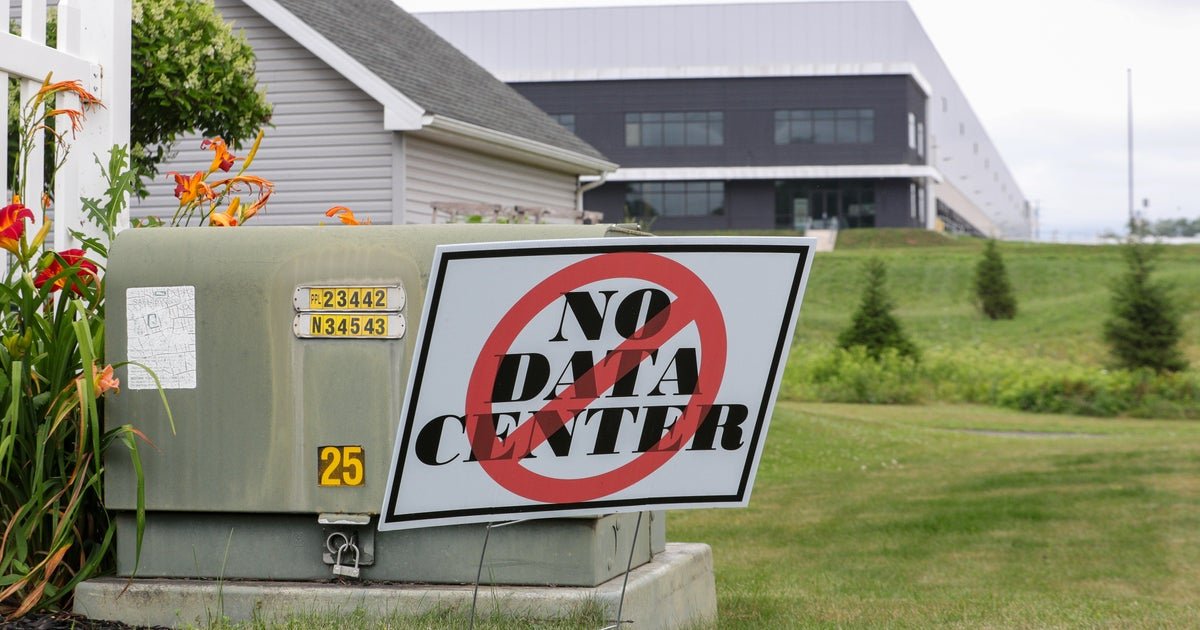
Technology stocks led the decline as investors reassessed the outlook for AI infrastructure after Democrats won control of Congress and scored victories in several states where data-center development had become an election issue.
Nvidia fell 9 percent, Broadcom lost 10 percent and an exchange-traded fund tracking semiconductor companies dropped more than 12 percent.
Trump said in a separate Truth Social post after the sell-off that he was “100% in favor” of what his administration calls “Super Intelligence.” He added that he would work with states that welcome its development, describing the technology as “gold.”
Trump’s intervention suggested the White House could seek to support AI projects in states that remain receptive even as newly elected officials elsewhere consider tighter rules for data centers.
The sell-off inflicted sharp one-day losses, particularly on technology companies, but the broader market remains far short of the threshold commonly used to define a bear market.
How the Current Rout Measures Up
On the broadest comparable measure, the S&P 500 remained approximately 6 percent below its record after Thursday’s close.
That is significantly smaller than the 20 percent decline commonly used to identify a bear market and far below the peak-to-trough losses suffered during previous crashes.
The present sell-off has some similarities with the early stages of the dot-com reversal, although it remains far smaller.
Both the dot-com episode and the current downturn followed enthusiasm for a transformative technology and concern that investment had run ahead of near-term returns.
There is an important difference.
Many dot-com businesses had little revenue and no viable path to profitability.
Today’s largest AI companies include profitable businesses with established customers and substantial cash flow.
Morgan Stanley said the election results could create delays and tougher restrictions for data-center projects, particularly at state level, while maintaining that the broader AI capital-expenditure cycle remained intact.
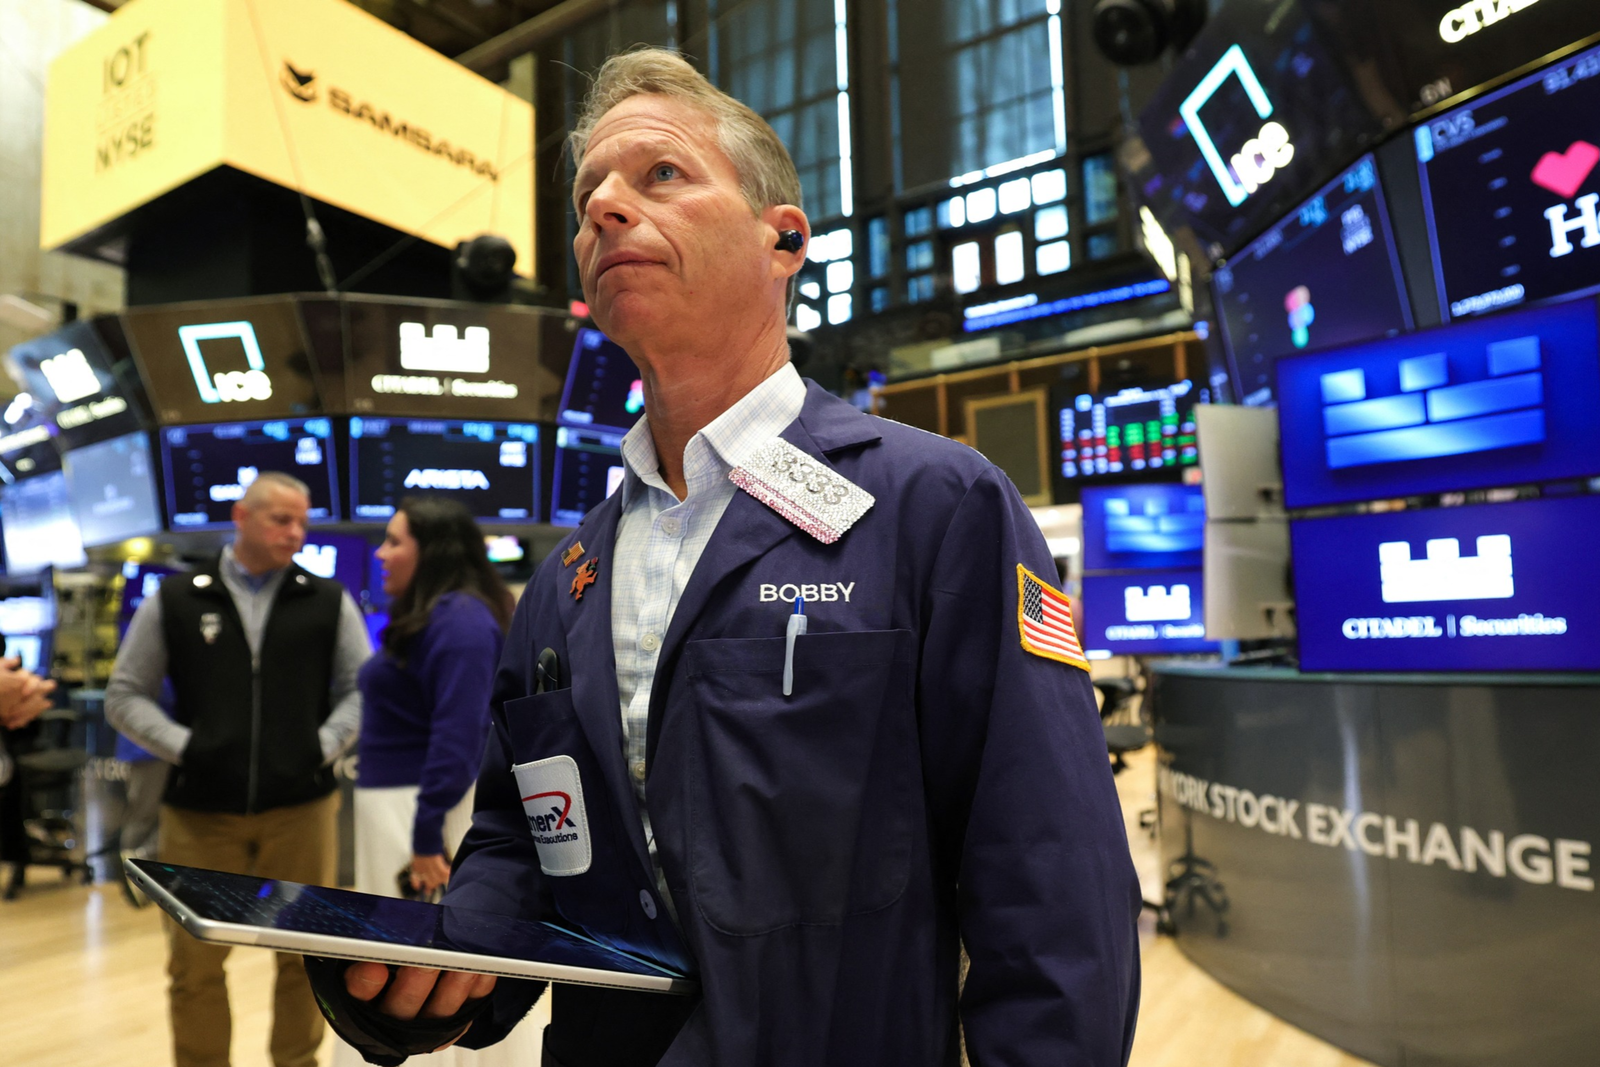
The technology comparison becomes more severe when placed beside the full dot-com collapse.
The S&P 500 fell about 49 percent between March 2000 and October 2002, while the technology-heavy Nasdaq lost 77 percent and did not regain its former record for 15 years.
Goldman Sachs said abundant funding and optimism over the internet allowed companies with little revenue or profit to achieve enormous valuations before the market for technology IPOs froze.
The current rout would therefore need to continue for much longer and spread far further beyond technology stocks before matching the dot-com bust.

The 2007-09 Financial Crisis
The 2007-09 crash was deeper and more systemic.
The S&P 500 lost approximately 56.8 percent between its October 2007 peak and March 2009 low.
That decline accompanied failures and emergency interventions throughout the financial system.
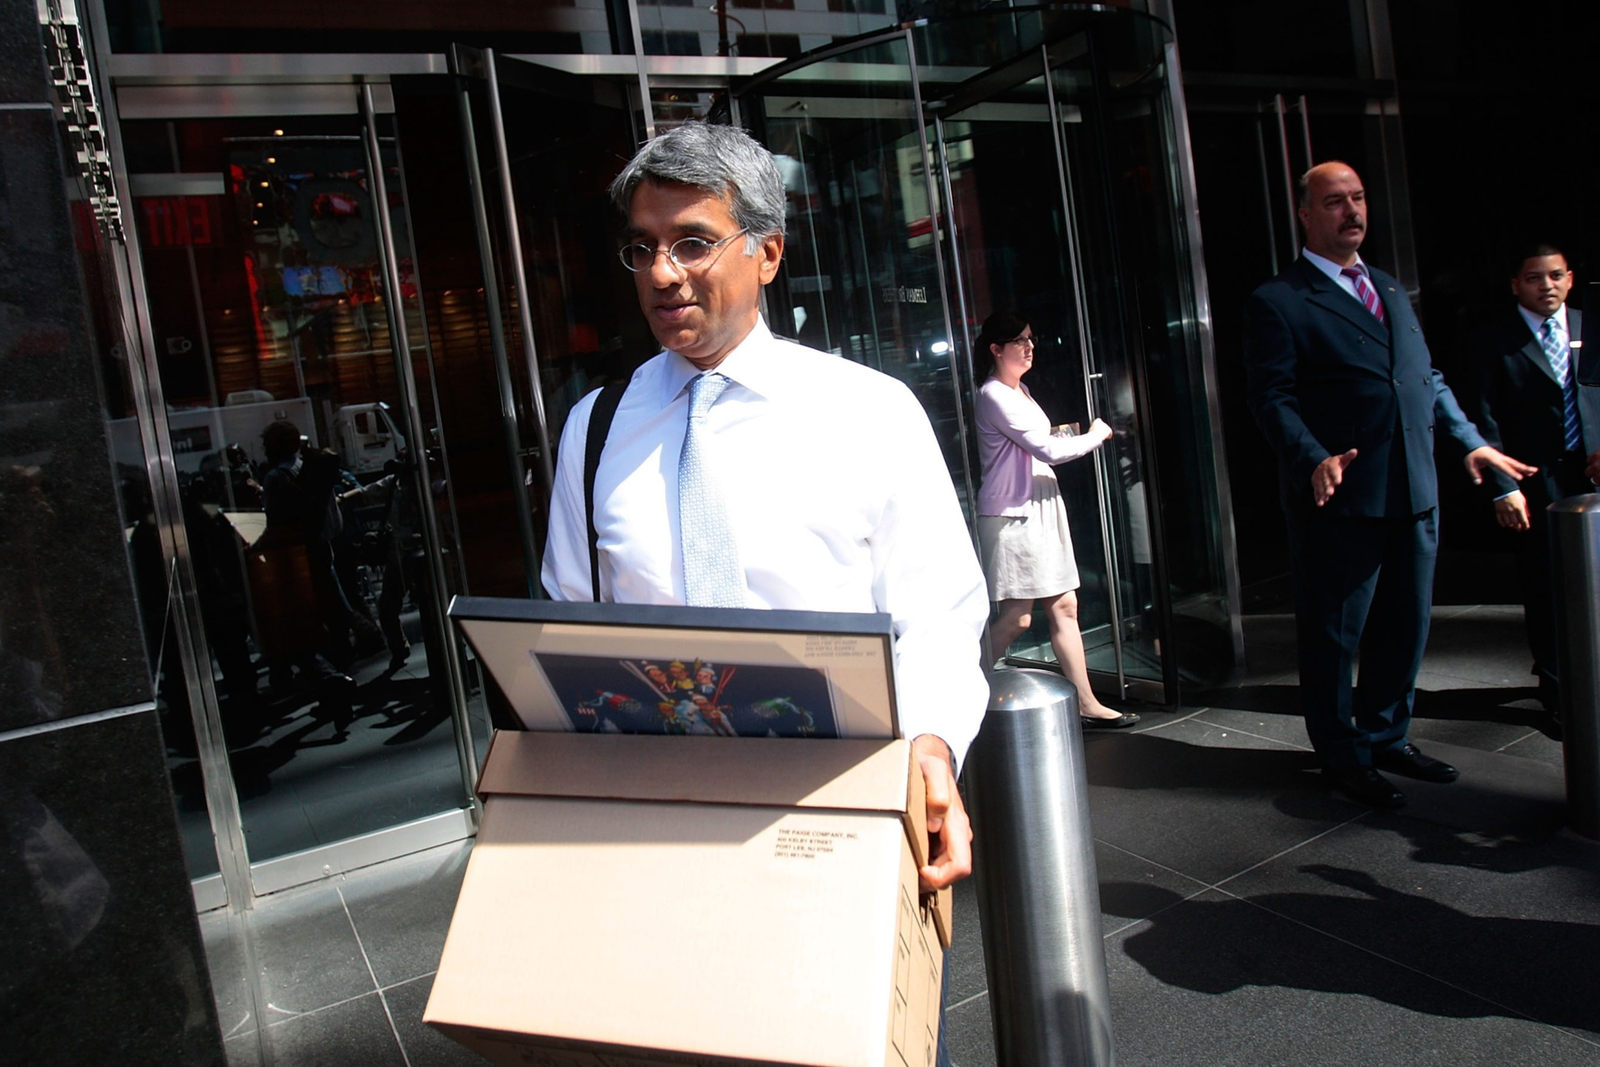
The Federal Reserve recorded the collapse or rescue of major institutions including Lehman Brothers, AIG, Fannie Mae and Freddie Mac, as well as the temporary disappearance of liquidity in crucial funding markets.
No comparable banking or credit breakdown has been established in the current downturn.
That distinction matters because a stock-market repricing can be painful without threatening the machinery that supplies credit to households and businesses.
The COVID-19 Crash
The pandemic crash provides the clearest recent comparison for how quickly markets can fall.
The S&P 500 dropped 33.9 percent between February 19 and March 23, 2020, as lockdowns abruptly halted large parts of the global economy. The index nevertheless recovered its former high by August.
Trading was halted by marketwide circuit breakers four times in March 2020.
By contrast, Thursday’s S&P 500 loss remained below the 7 percent threshold that would trigger the first circuit breaker under current New York Stock Exchange rules.
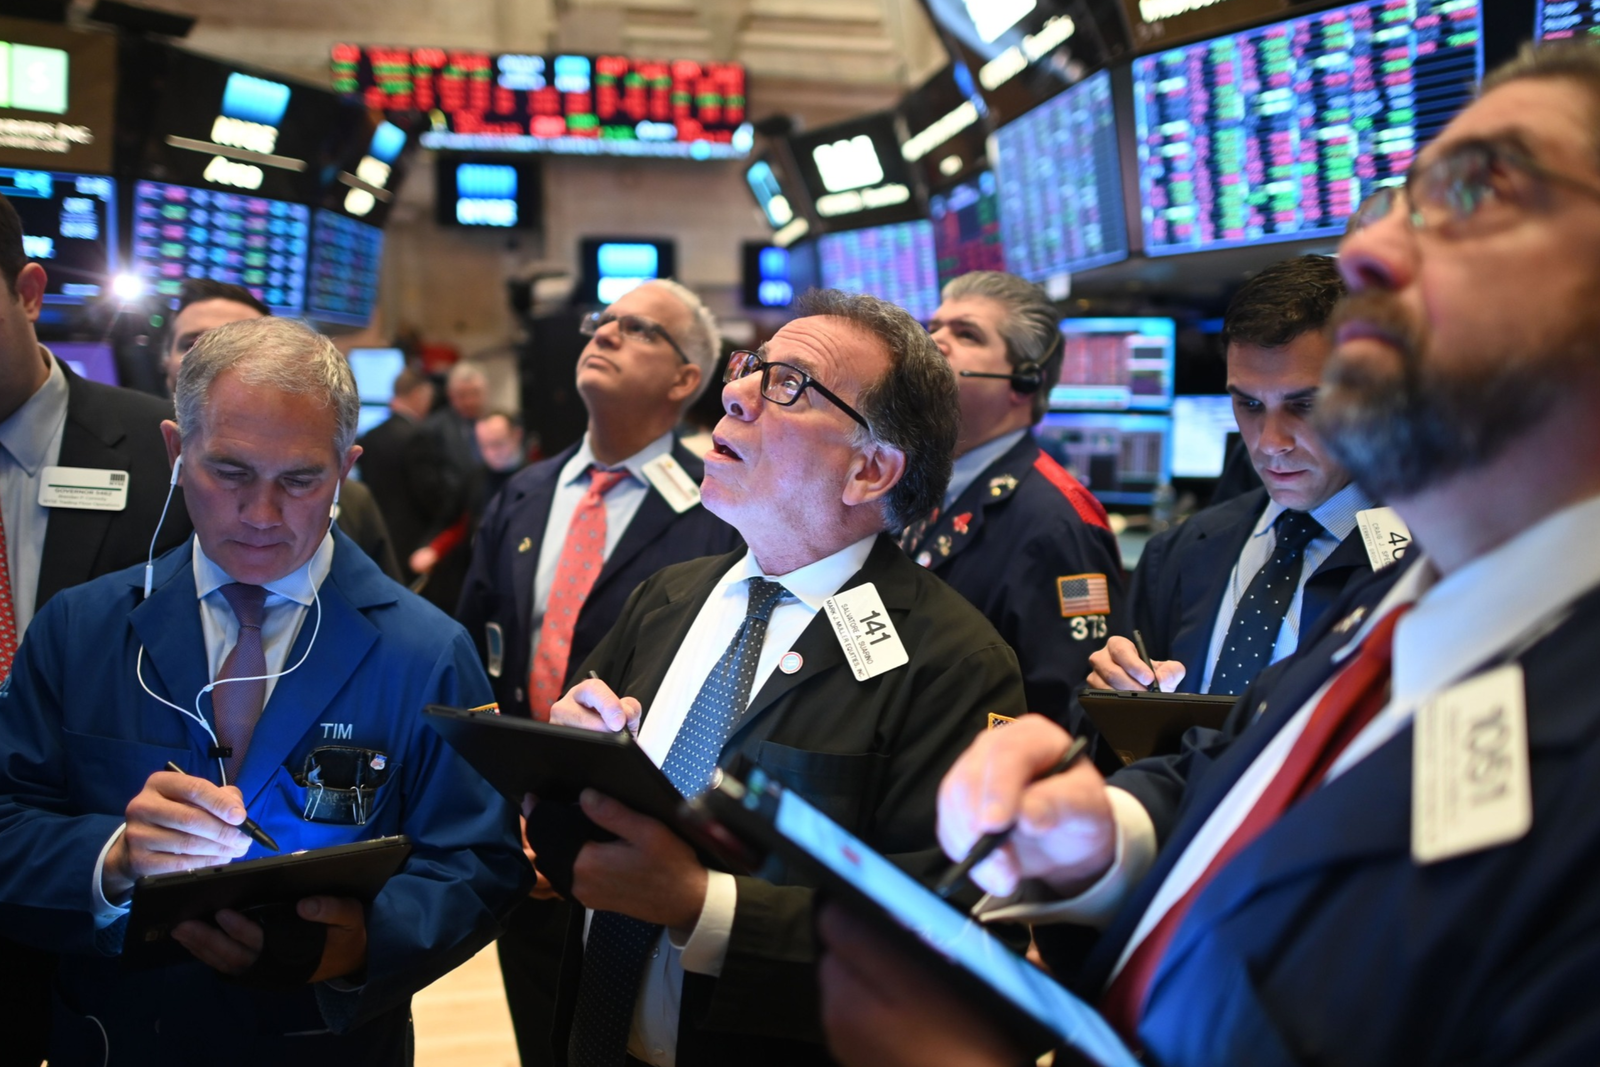
The 2022 Bear Market
The most-recent U.S. bear market also unfolded during a midterm-election year, but it was not primarily an election-driven rout.
The S&P 500 fell 25.4 percent between January 3 and October 12, 2022. Four-decade-high inflation and aggressive Federal Reserve interest-rate increases reduced the value that investors were willing to place on technology and other growth stocks.
The market had already reached its low before the November 8 midterms.
Two days after the election, the S&P 500 surged 5.54 percent and the Nasdaq Composite gained 7.35 percent after softer inflation data raised hopes that the Federal Reserve could slow its rate increases. It illustrates how economic data and monetary policy can outweigh election results.

Black Monday and the 1929 Collapse
Black Monday remains the benchmark for a single-session crash.
On October 19, 1987, the Dow fell 22.6 percent, still its largest one-day percentage decline.
The S&P 500 fell about 20 percent as trading systems struggled with the volume of transactions and automated selling intensified the slide.
Black Monday was not caused by a single economic shock.
Stocks had climbed rapidly during the first seven months of 1987, while rising interest rates, a weakening dollar and concerns about the U.S. trade deficit undermined investor confidence.
As prices fell, computerized portfolio-insurance strategies instructed institutions to sell stock-index futures. It created a feedback loop in which falling markets generated further sales.
The 1929 crash was more destructive over time.
The Dow fell nearly 13 percent on October 28 and almost 12 percent the following day.
By July 1932, it stood 89 percent below its peak and did not recover its 1929 high until November 1954.
The 1929 crash followed years of speculative investment and widespread buying on margin. This left the market vulnerable when confidence weakened, and panic selling forced heavily leveraged investors to unload their shares.
Both episodes show why the current movement should not yet be placed in the same category.
Its one-day losses were substantial, particularly for technology stocks. However, they were far smaller than Black Monday and have not developed into the prolonged economic collapse seen after 1929.
And history also offers a counterweight to the immediate concern.
Since 1974, the S&P 500 has averaged a 12.4 percent return during the six months after midterm elections and was positive in all 13 cycles examined by Charles Schwab.
That pattern is not a forecast, but it underlines how unusual it would be for an election alone to determine the market’s longer-term direction.
Register for our November 10 discussion, ‘Newsweek Webinar: How the Politics of AI Could Shape Midterms,’ which will examine how AI policy played in key races, data centers, lobbying and the political lines that emerged.
Newsweek’s reporters and editors used Martyn, our AI assistant, to produce this story. Learn more about Martyn here.
Contact Newsweek editors on this story: Sam Stevenson and James Debens