NasdaqCM – Nasdaq Real Time Price • USD
At close: 4:00 PM EDT
After hours: 4:41 PM EDT
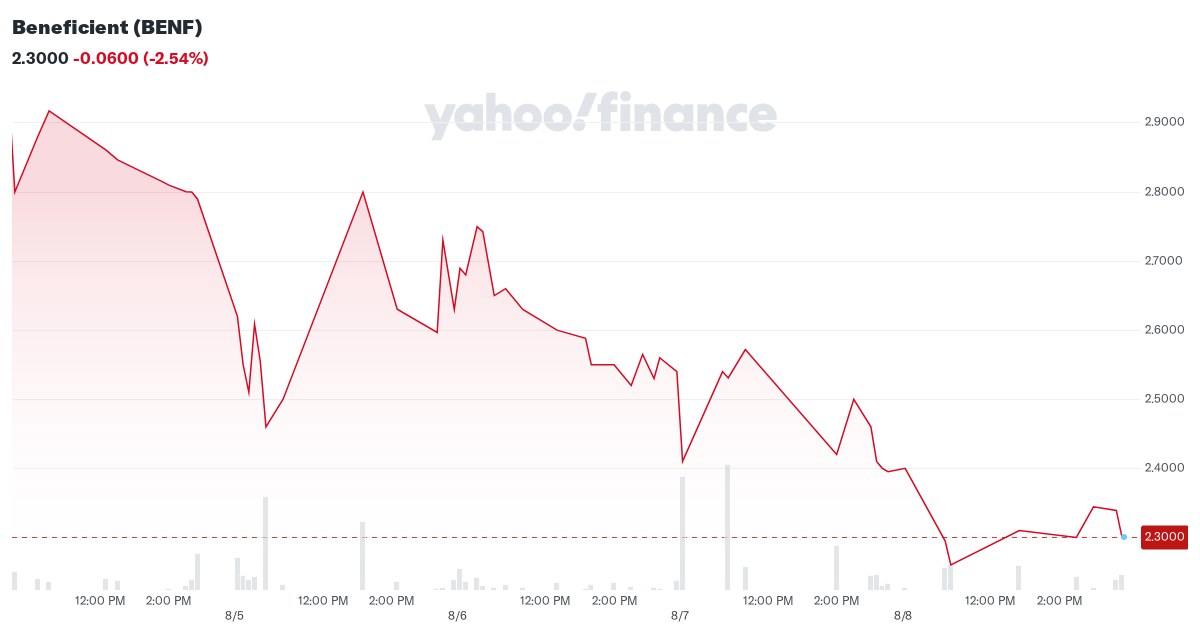
- Previous Close
2.3600 - Open
2.4000 - Bid —
- Ask —
- Day’s Range
2.2550 – 2.4000 - 52 Week Range
1.8600 – 287.2000 - Volume
10,123 - Avg. Volume
933,327 - Market Cap (intraday)
9.765M - Beta (5Y Monthly) -0.96
- PE Ratio (TTM)
— - EPS (TTM)
-53,864.8008 - Earnings Date —
- Forward Dividend & Yield —
- Ex-Dividend Date —
- 1y Target Est
—
Beneficient, a technology-enabled financial services company, provides liquidity solutions and related trustee, custody and trust administrative services to participants in the alternative asset industry in the United States. It operates through Ben Liquidity, Ben Custody, and Customer ExAlt Trusts segments. The company offers Ben AltAccess platform for secure, online, and end-to-end delivery of each of the Ben business unit products and services, including upload documents, and work through tasks, and complete their transactions with standardized transaction agreements. It also provides Ben Liquidity, which offers alternative asset liquidity and fiduciary financing products; Ben Custody that provides custody and trust administration services to trustees and document custodian services to customers; and Ben Markets, which provides broker-dealer and transfer agency services. In addition, the company provides Ben Insurance Services, which offers insurance products and services; and Ben Data that provides data collection, evaluation, and analytics products and services. It serves individual and institutional investors, wealth advisors, and general partners. Beneficient is based in Dallas, Texas.
March 31
Fiscal Year Ends
Trailing total returns as of 8/8/2024, which may include dividends or other distributions. Benchmark is .
YTD Return
1-Year Return
3-Year Return
5-Year Return
Select to analyze similar companies using key performance metrics; select up to 4 stocks.
Valuation Measures
As of 8/7/2024
-
Market Cap
9.93M
-
Enterprise Value
122.53M
-
Trailing P/E
—
-
Forward P/E
—
-
PEG Ratio (5yr expected)
—
-
Price/Sales (ttm)
—
-
Price/Book (mrq)
0.21
-
Enterprise Value/Revenue
—
-
Enterprise Value/EBITDA
—
Financial Highlights
Profitability and Income Statement
-
Profit Margin
0.00%
-
Return on Assets (ttm)
-8.45%
-
Return on Equity (ttm)
-194.18%
-
Revenue (ttm)
-98.7M
-
Net Income Avi to Common (ttm)
-2.1B
-
Diluted EPS (ttm)
-53,864.8008
Balance Sheet and Cash Flow
-
Total Cash (mrq)
7.91M
-
Total Debt/Equity (mrq)
221.00%
-
Levered Free Cash Flow (ttm)
-2.58M