NYSE – Nasdaq Real Time Price • USD
At close: September 20 at 4:00 PM EDT
After hours: September 20 at 7:59 PM EDT
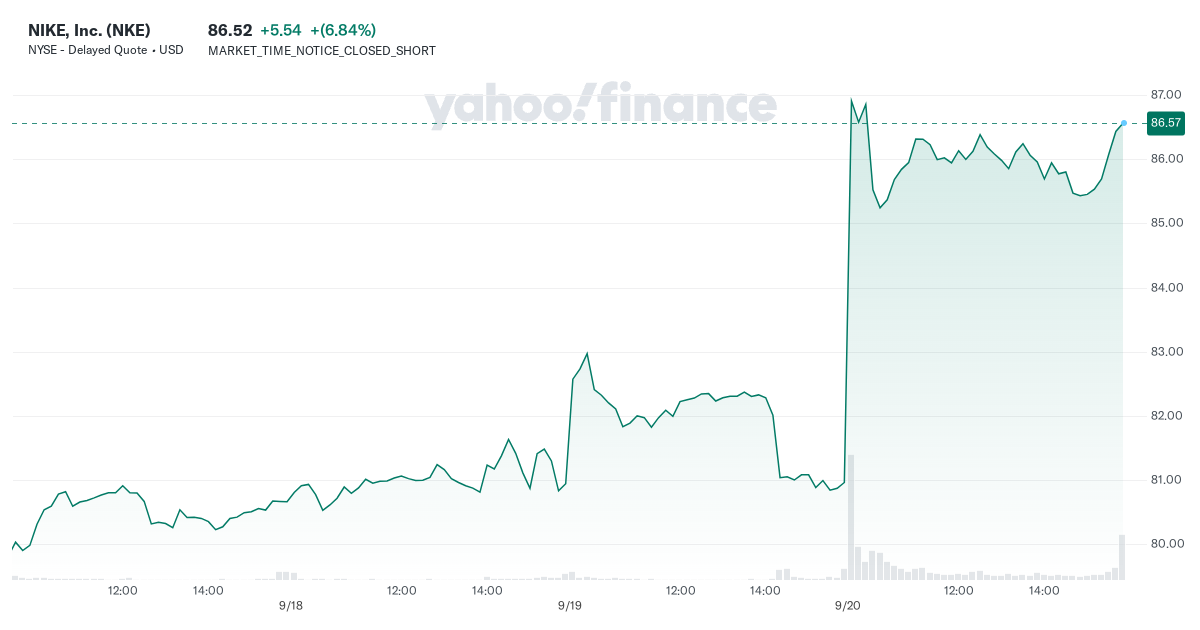
- Previous Close
80.98 - Open
87.87 - Bid 86.37 x 900
- Ask 86.40 x 800
- Day’s Range
84.81 – 88.00 - 52 Week Range
70.75 – 123.39 - Volume
52,012,944 - Avg. Volume
15,888,538 - Market Cap (intraday)
129.725B - Beta (5Y Monthly) 1.01
- PE Ratio (TTM)
23.20 - EPS (TTM)
3.73 - Earnings Date Oct 1, 2024
- Forward Dividend & Yield 1.48 (1.71%)
- Ex-Dividend Date Sep 3, 2024
- 1y Target Est
91.83
NIKE, Inc., together with its subsidiaries, engages in the design, development, marketing, and sale of athletic footwear, apparel, equipment, accessories, and services worldwide. The company provides athletic and casual footwear, apparel, and accessories under the NIKE, Jumpman, Converse, Chuck Taylor, All Star, One Star, Star Chevron, and Jack Purcell trademarks. It also sells a line of performance equipment and accessories comprising bags, sport balls, socks, eyewear, timepieces, digital devices, bats, gloves, protective equipment, and other equipment for sports activities under the NIKE brand; and various plastic products to other manufacturers. In addition, the company markets apparel with licensed college and professional team, and league logos, as well as sells sports apparel; licenses unaffiliated parties to manufacture and sell apparel, digital devices, and applications and other equipment for sports activities under NIKE-owned trademarks; and operates digital platforms, including fitness and activity apps; sport, fitness, and wellness content; and digital services and features in retail stores. It sells its products to footwear stores; sporting goods stores; athletic specialty stores; department stores; skate, tennis, and golf shops; and other retail accounts through NIKE-owned retail stores, digital platforms, independent distributors, licensees, and sales representatives. The company was founded in 1964 and is headquartered in Beaverton, Oregon.
79,400
Full Time Employees
Trailing total returns as of 9/20/2024, which may include dividends or other distributions. Benchmark is .
YTD Return
1-Year Return
3-Year Return
5-Year Return
Select to analyze similar companies using key performance metrics; select up to 4 stocks.
Valuation Measures
As of 9/20/2024
-
Market Cap
129.72B
-
Enterprise Value
130.09B
-
Trailing P/E
23.20
-
Forward P/E
28.01
-
PEG Ratio (5yr expected)
3.14
-
Price/Sales (ttm)
2.58
-
Price/Book (mrq)
8.99
-
Enterprise Value/Revenue
2.53
-
Enterprise Value/EBITDA
18.18
Financial Highlights
Profitability and Income Statement
-
Profit Margin
11.10%
-
Return on Assets (ttm)
11.16%
-
Return on Equity (ttm)
40.09%
-
Revenue (ttm)
51.36B
-
Net Income Avi to Common (ttm)
5.7B
-
Diluted EPS (ttm)
3.73
Balance Sheet and Cash Flow
-
Total Cash (mrq)
11.58B
-
Total Debt/Equity (mrq)
83.04%
-
Levered Free Cash Flow (ttm)
5.9B