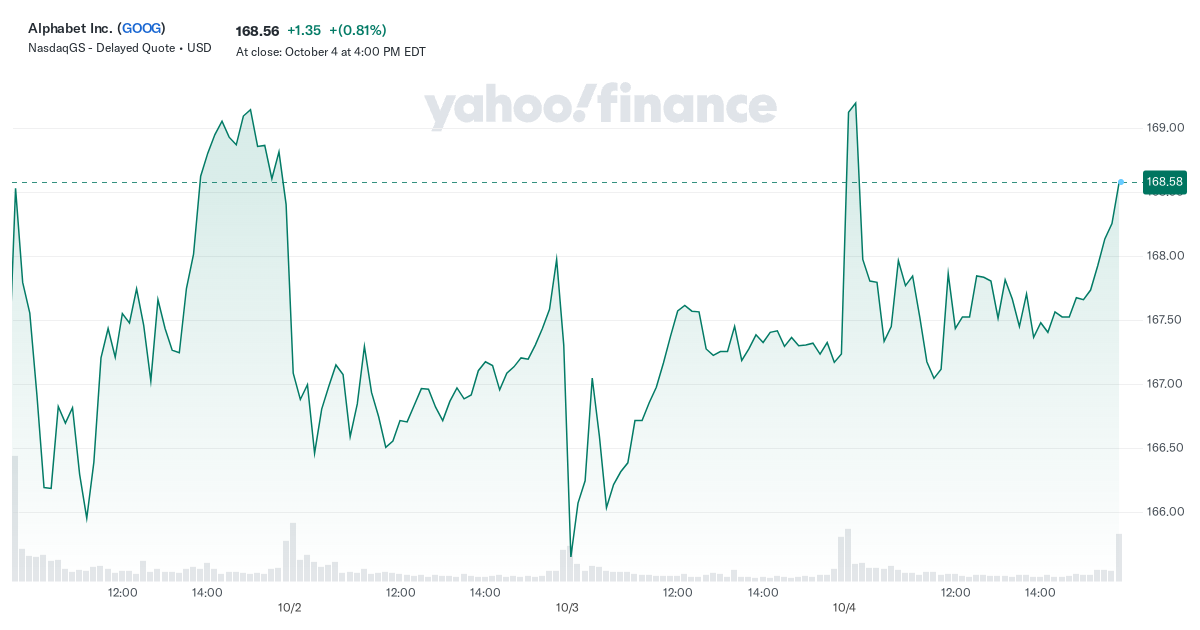
NasdaqGS – Nasdaq Real Time Price USD
At close: October 4 at 4:00 PM EDT
After hours: October 4 at 7:59 PM EDT
- Previous Close
167.21 - Open
169.20 - Bid 160.63 x 100
- Ask 177.66 x 100
- Day’s Range
166.96 – 169.55 - 52 Week Range
121.46 – 193.31 - Volume
11,435,318 - Avg. Volume
17,828,470 - Market Cap (intraday)
2.065T - Beta (5Y Monthly) 1.04
- PE Ratio (TTM)
24.15 - EPS (TTM)
6.98 - Earnings Date Oct 22, 2024 – Oct 28, 2024
- Forward Dividend & Yield 0.80 (0.47%)
- Ex-Dividend Date Sep 9, 2024
- 1y Target Est
200.15
Alphabet Inc. offers various products and platforms in the United States, Europe, the Middle East, Africa, the Asia-Pacific, Canada, and Latin America. It operates through Google Services, Google Cloud, and Other Bets segments. The Google Services segment provides products and services, including ads, Android, Chrome, devices, Gmail, Google Drive, Google Maps, Google Photos, Google Play, Search, and YouTube. It is also involved in the sale of apps and in-app purchases and digital content in the Google Play and YouTube; and devices, as well as in the provision of YouTube consumer subscription services. The Google Cloud segment offers infrastructure, cybersecurity, databases, analytics, AI, and other services; Google Workspace that include cloud-based communication and collaboration tools for enterprises, such as Gmail, Docs, Drive, Calendar, and Meet; and other services for enterprise customers. The Other Bets segment sells healthcare-related and internet services. The company was incorporated in 1998 and is headquartered in Mountain View, California.
179,582
Full Time Employees
December 31
Fiscal Year Ends
Trailing total returns as of 10/4/2024, which may include dividends or other distributions. Benchmark is .
YTD Return
1-Year Return
3-Year Return
5-Year Return
Select to analyze similar companies using key performance metrics; select up to 4 stocks.
Valuation Measures
As of 10/4/2024
-
Market Cap
2.06T
-
Enterprise Value
1.99T
-
Trailing P/E
24.18
-
Forward P/E
19.23
-
PEG Ratio (5yr expected)
1.14
-
Price/Sales (ttm)
6.46
-
Price/Book (mrq)
6.90
-
Enterprise Value/Revenue
6.07
-
Enterprise Value/EBITDA
17.26
Financial Highlights
Profitability and Income Statement
-
Profit Margin
26.70%
-
Return on Assets (ttm)
15.96%
-
Return on Equity (ttm)
30.87%
-
Revenue (ttm)
328.28B
-
Net Income Avi to Common (ttm)
87.66B
-
Diluted EPS (ttm)
6.98
Balance Sheet and Cash Flow
-
Total Cash (mrq)
100.72B
-
Total Debt/Equity (mrq)
9.55%
-
Levered Free Cash Flow (ttm)
43.99B