Rate-easing cycles and bear markets tend to go hand-in-hand.
Just six trading days remain before we close the curtain on what should go down as a splendid year for Wall Street. As of the closing bell on Dec. 18, the mature-stock-driven Dow Jones Industrial Average (^DJI 1.18%), broad-based S&P 500 (^GSPC 1.09%), and innovation-fueled Nasdaq Composite (^IXIC 1.03%) have gained 12%, 23%, and 29%, respectively.
The stock market’s phenomenal year has been propelled by a confluence of factors that include:
- The rise of artificial intelligence (AI), which is a $15.7 trillion addressable market according to research by PwC.
- Excitement surrounding stock splits in some of Wall Street’s most influential companies.
- Better-than-expected corporate earnings.
- President-elect Donald Trump’s victory. The Dow Jones, S&P 500, and Nasdaq Composite soared during Trump’s first term in office.
However, warning signs are mounting that suggest stocks may have come too far, too fast. For instance, the S&P 500’s Shiller price-to-earnings (P/E) ratio is sitting at its third-priciest reading in 153 years.
Potentially less obvious correlative events, such as Federal Reserve rate-easing cycles, have also served as an ominous warning for investors throughout the 21st century.

Image source: Getty Images.
Caveat emptor (buyer beware), investors?
The Federal Reserve is tasked with supporting economic growth while keeping the prevailing rate of inflation from getting out of hand. It aims to accomplish this goal by tweaking monetary policy as needed. These actions may include adjusting the benchmark federal funds rate, as well as open-market operations, which involves purchasing or selling long-term Treasury bonds in order to increase or decrease yields. I know… exciting stuff, right?
What is particularly interesting about the central bank’s monetary policy actions is that stocks tend to behave opposite of what you’d logically expect to happen.
For example, if the Fed is raising interest rates and making borrowing costlier for businesses, the logical expectation is that corporate growth rates would slow as lending diminishes. Yet some of the stock market’s most robust gains in the 21st century have occurred during rate-hiking cycles where the Fed is angling to keep the prevailing rate of inflation under control.
Conversely, lowering interest rates would, on paper, appear to be a good thing since it’s making borrowing less costly and encouraging lending. But as history has shown, rate-easing cycles aren’t all they’re cracked up to be.
The nation’s central bank doesn’t alter monetary policy on a whim. It usually does so as a reaction to multiple economic data points. If the Fed is reducing the federal funds rate, it usually means the central bank is concerned about economic weakness or deflation taking shape.
Rate-easing cycles have correlated with big moves lower in the stock market
Since this century began, the nation’s central bank has kicked off four rate-easing cycles, including the one that’s ongoing. All three previous cycles correlated with sizable moves lower in Wall Street’s benchmark index, the S&P 500.
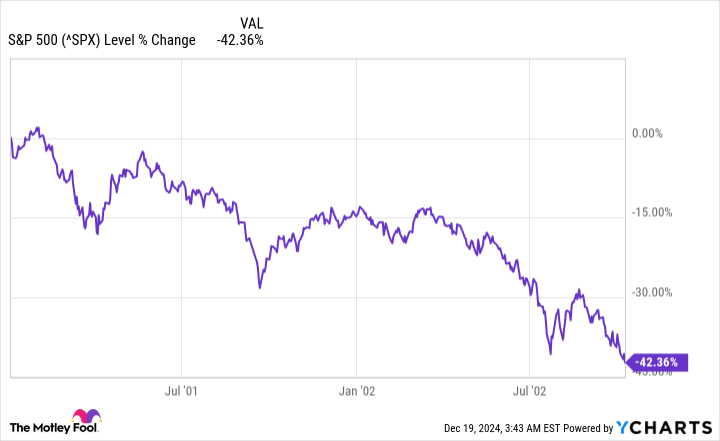
The first shift to a dovish monetary policy officially occurred on Jan. 3, 2001. Over a span of roughly 11 months, the nation’s central bank lowered its federal funds rate from 6.5% to 1.75%. But as you can see in the chart below, the S&P 500 took 645 calendar days following this initial rate reduction before finding its bottom. All told, the S&P 500 shed more than 42% of its value after this inaugural cut.
^SPX data by YCharts. Return rate from Jan. 3, 2001-Oct. 9, 2022.
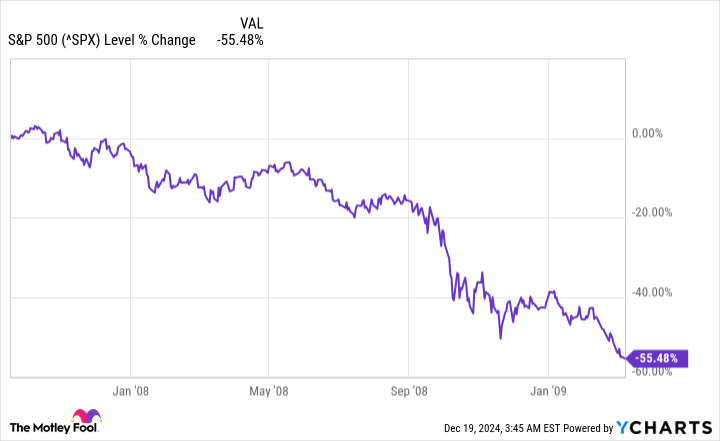
The Federal Reserve’s second round of rate cuts began just prior to the financial crisis taking shape on Sept. 18, 2007. With this crisis being unprecedented, perhaps it’s no surprise that the Fed responded with a historic move of its own. Over a 15-month stretch, it lowered the federal funds rate from 5% to a historically low range of 0% to 0.25%.
But as you’ll note in the following chart, the S&P 500 took 538 calendar days after this initial reduction in September 2007 to reach its nadir in March 2009. It lost more than 55% of its value, with the growth-focused Nasdaq Composite getting hit even harder.
^SPX data by YCharts. Return rate from Sept. 18, 2007-March 9, 2009.
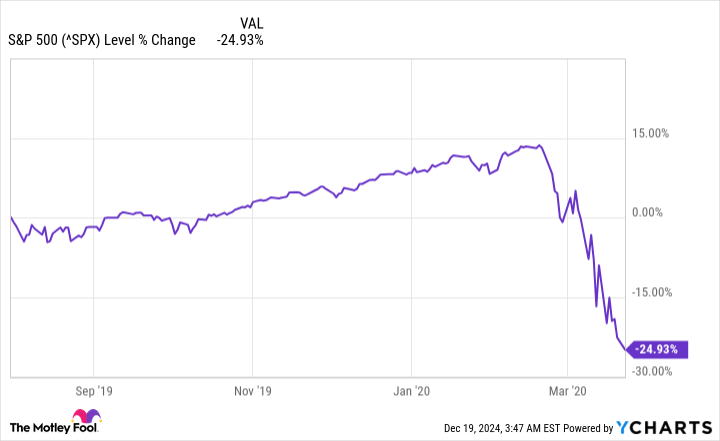
The third rate-easing cycle undertaken by the Fed began at the end of July 2019. Due to the COVID-19 pandemic taking shape, it took less than eight months to lower the federal funds rate from a range of 2.25% to 2.5% back to 0% to 0.25%.
As you can see below, the benchmark S&P 500 shed nearly 25% of its value over 236 calendar days following this initial rate reduction.
^SPX data by YCharts. Return rate from July 31, 2019-March 23, 2020.
One final thing to note is that recessions took shape not long after the three previous rate-easing cycles began. Though a recession doesn’t guarantee stocks will head lower, approximately two-thirds of the S&P 500’s peak-to-trough drawdowns since 1927 have occurred during, not prior to, a recession being declared, based on data from Bank of America Global Research.
Long story short, rate-easing cycles have historically been bad news for the stock market in the 21st century.

Image source: Getty Images.
There’s a silver lining, too
Although history rhyming on Wall Street might sound like bad news, based on the correlation between rate-easing cycles and big moves lower in the Dow Jones Industrial Average, S&P 500, and Nasdaq Composite, it’s actually fantastic news for investors with a long-term mindset.
The blunt truth is that no amount of wishful thinking is going to stop the U.S. economy from contracting every now and then. Likewise, stock market corrections and bear markets are both normal and inevitable. But what’s important to note is that economic cycles and investing cycles aren’t linear.
For instance, the U.S. economy has navigated its way through 12 recessions since World War II ended in September 1945. Nine of these one dozen downturns resolved in less than 12 months, while none of the remaining three made it past 18 months in length.
On the other side of the coin, most economic expansions have endured for multiple years, including two periods of growth that surpassed the 10-year mark. Even though recessions are inevitable, they don’t last long, nor do they have an adverse impact on long-term growth rates.
It’s a similar story when comparing bear and bull markets on Wall Street.
— Bespoke (@bespokeinvest) June 8, 2023
In June 2023, shortly after the S&P 500 was confirmed to be in a new bull market, the researchers at Bespoke Investment Group posted the data set you see above on social media platform X. It shows the calendar-day length of every bear and bull market in the S&P 500 since the start of the Great Depression in September 1929.
Over this 94-year period, there were 27 S&P 500 bear markets. The average downturn lasted for only 286 calendar days (about 9.5 months), with the longest bear market on record totaling 630 calendar days.
On the flipside, the typical S&P 500 bull market clocked in at 1,011 calendar days, which is about 3.5 times longer than the average bear market. If Bespoke’s data set is extrapolated to present day, 14 out of 27 S&P 500 bull markets have lasted longer than the lengthiest bear market.
Even if history rhymes and the stock market, once again, turns lower following the kickoff of the latest rate-easing cycle, there’s an abundance of data to suggest that patience and perspective will still pay off handsomely for investors.
Bank of America is an advertising partner of Motley Fool Money. Sean Williams has positions in Bank of America. The Motley Fool has positions in and recommends Bank of America. The Motley Fool has a disclosure policy.

