
- US Stock Benchmarks are rallying timidly after a long Easter weekend
- Even with Oil still at $112, Traders are slowly coming back to lift US Markets but heavy catalysts could be awaiting
- Exploring Technical Levels for the Dow Jones, Nasdaq and S&P 500
Traders are slowly returning from a well-deserved Easter break, with volumes set to recover fully tomorrow.
With the week starting on a softer pace, the US Dollar is taking a step back to leave some space for other FX currencies, Bitcoin (reaching $70,000!) and Equities after having worked overtime until today.
Optimism had made a sharp return throughout last week as Traders began to price in a proper truce in Iran, but this isn’t such a given, as Iran reportedly still believes it can leverage the US’s precipitated demands for a deal to tilt the scales in its favor.
Stocks across the globe are still way off their War troughs, with market sentiment tilting more towards a short operation than a catastrophic long war, as observed in Vietnam, Afghanistan, and Iraq – enough to limit a prolonged bear trend.
The War itself is advancing at a remarkable pace, but the main element of turmoil across the region remains the Strait of Hormuz and its link to global Oil prices.
It has been easy for Participants to ignore the pricing of imminent Rate Hikes in upcoming meetings of global Central Banks, but this reality could hit like a train if WTI and Brent remain above $100 for much longer.
Tomorrow will be decisive in that aspect, as the US President announced throughout the weekend that Tuesday evening (8:00 PM ET) will be the deadline for a deal – And Iran just rejected the proposed 45-Day Ceasefire deal that would lead to a longer-lasting peace.
The Islamic regime is still persistent in maintaining its threatening ballistic missile program, which has caused damage all around the Middle East since the commencement of the War.
To get ready for this week, which looks to be a heavy one (US CPI on Friday!) , let’s examine the intraday charts and trading levels for the major US indexes: the Dow Jones, Nasdaq, and S&P 500.
Current Session’s Stock Heatmap
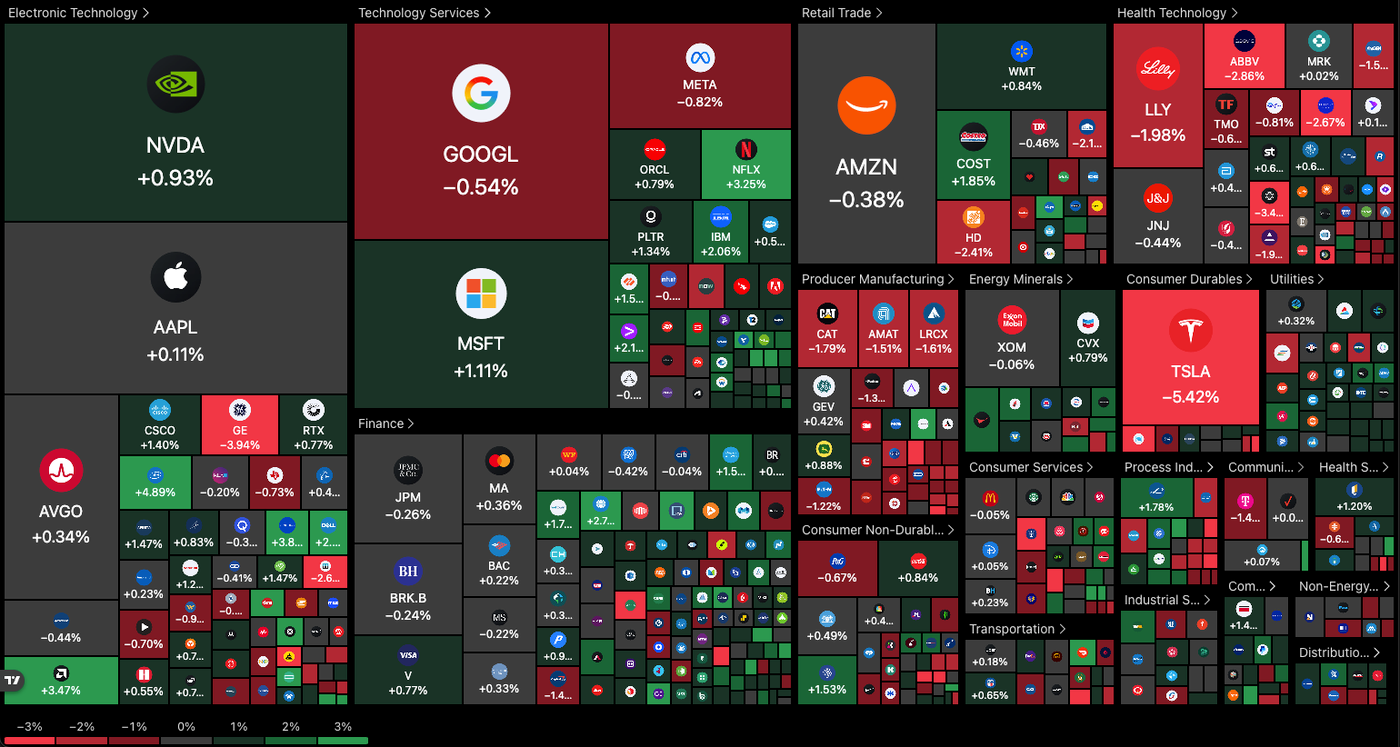
Today’s Market heatmap is heavily fractured, with gains and losses spread throughout the entire board, but bulls taking the advantage – Such spread out gains indicate Index buying rather than actual tactical positioning (with sentiment playing tricks, players are reluctant for precision plays).
Netflix, AMD, Intel and other Electronics are doing heavy lifting, pushing the Nasdaq to outperform other Indexes on this thin Monday trading – Expect a lot of volatility in coming days!
Dow Jones 4H Chart and Trading Levels
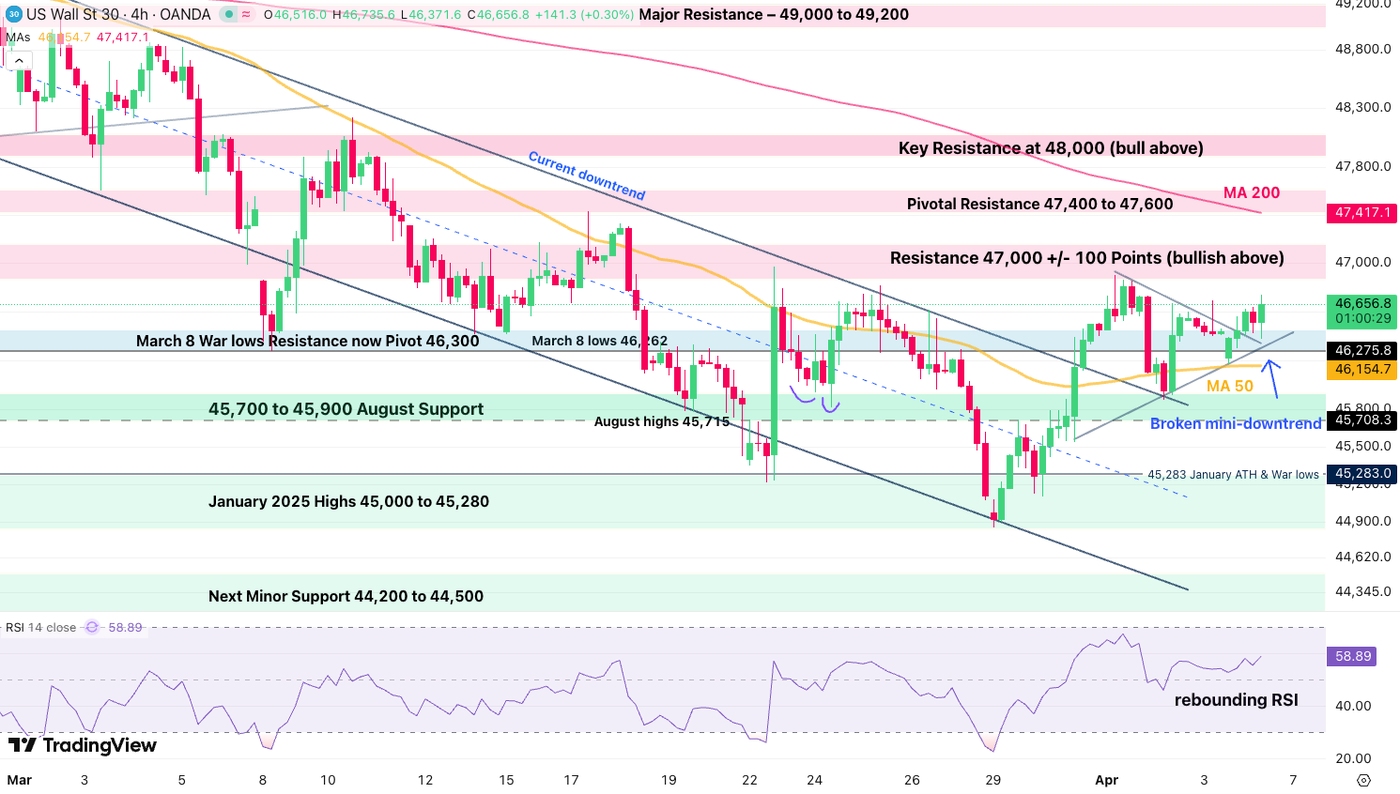
The Dow Jones is stuck in a 46,300-47,000 range as traders await further clarity on the Middle East situation.
Still, the bearish trend has now completely stalled, allowing a more balanced price action ahead. Look for a clean break and a 4H candle close above/below the range levels for a breakout – A session close will confirm the direction.
- Tomorrow’s deadline will be decisive in determining the direction, as it’s still difficult to assume a full-on bullish rebound before then (even if the technicals are hinting at one).
- With its RSI Momentum tilting higher (relative to the S&P 500), it will be poised for more upside than its peers in a bullish event.
Dow Jones technical levels for trading:
Resistance Levels
- Resistance 47,000 +/- 100 Points (bullish above)
- Momentum Resistance 47,400 to 47,600
- Key Resistance at 48,000
- Major Resistance – 49,000 to 49,200
Support Levels
- March 8 War lows Resistance now Pivot 46,300 (bearish below)
- 45,700 to 45,900 August Support
- January 2025 Highs 45,000 to 45,280
- Next Minor Support 44,200 to 44,500
- Major Support 43,500 to 43,750
Nasdaq 4H Chart and Trading Levels
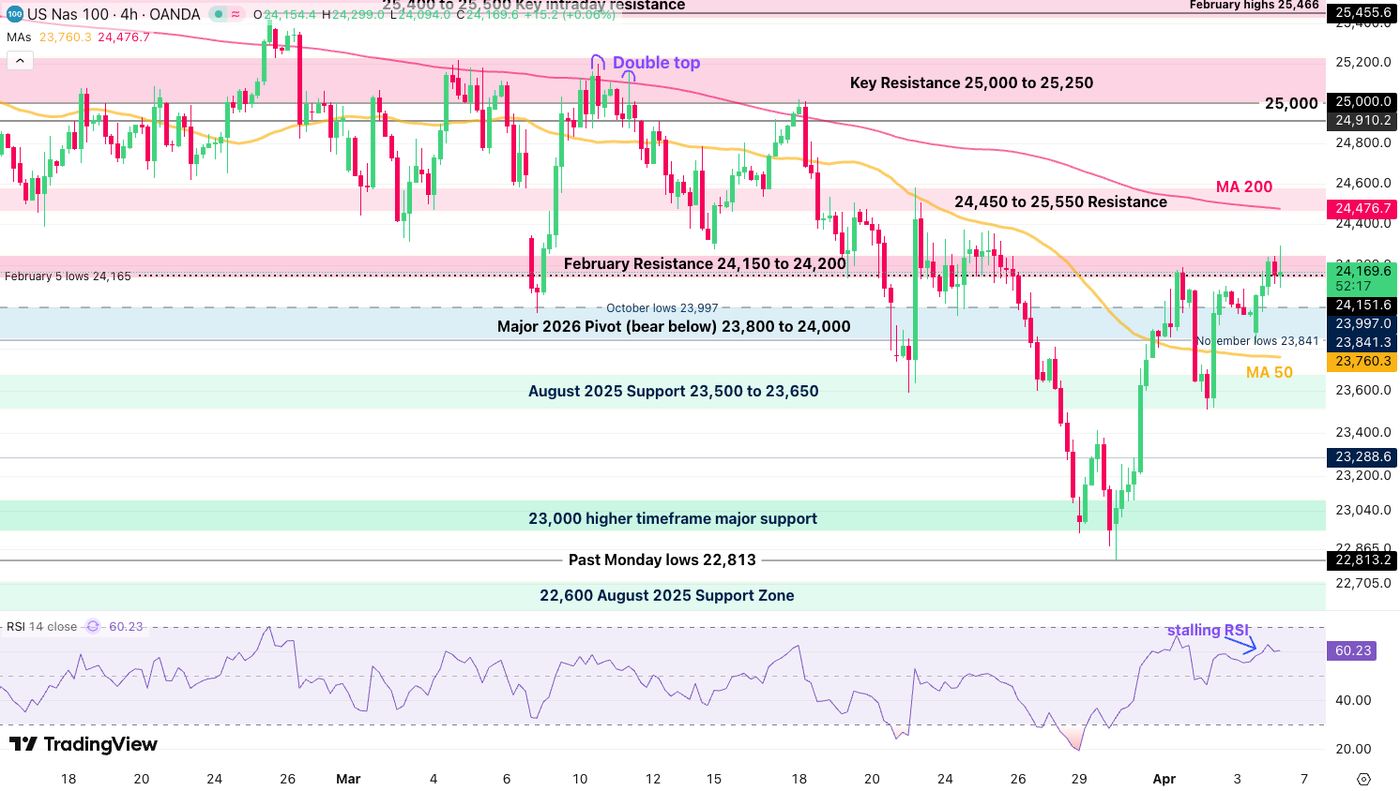
Nasdaq has outperformed its peers in the recent rebound, up 5.70% from its past Monday lows – But this outperformance may pay interest in coming trading.
Compared to the rebounding Dow Jones RSI, the momentum for the Tech-Heavy index is now turning lower and pointing to imminent stalling at the February 24,150-24,200 resistance.
- Remaining above 24,000 on Wednesday morning (post Trump deadline) will maintain a bullish short-term outlook.
- Breaking the psychological level points to the opposite.
Nasdaq technical levels of interest:
Resistance Levels
- February Resistance 24,150 to 24,200 (immediate test)
- 24,450 to 25,550 resistance (4H 200-period MA)
- Key Resistance 25,000 to 25,200 (Range highs – Long-term Bullish above)
Support Levels
- Major 2026 Pivot (bear below) 23,800 to 24,000
- August 2025 Support 23,500 to 23,650
- 22,900 to 23,000 higher timeframe major support
- 22,600 August 2025 Support Zone
- Early 2025 ATH at 22,000 to 22,229 Support
S&P 500 4H Chart and Trading Levels
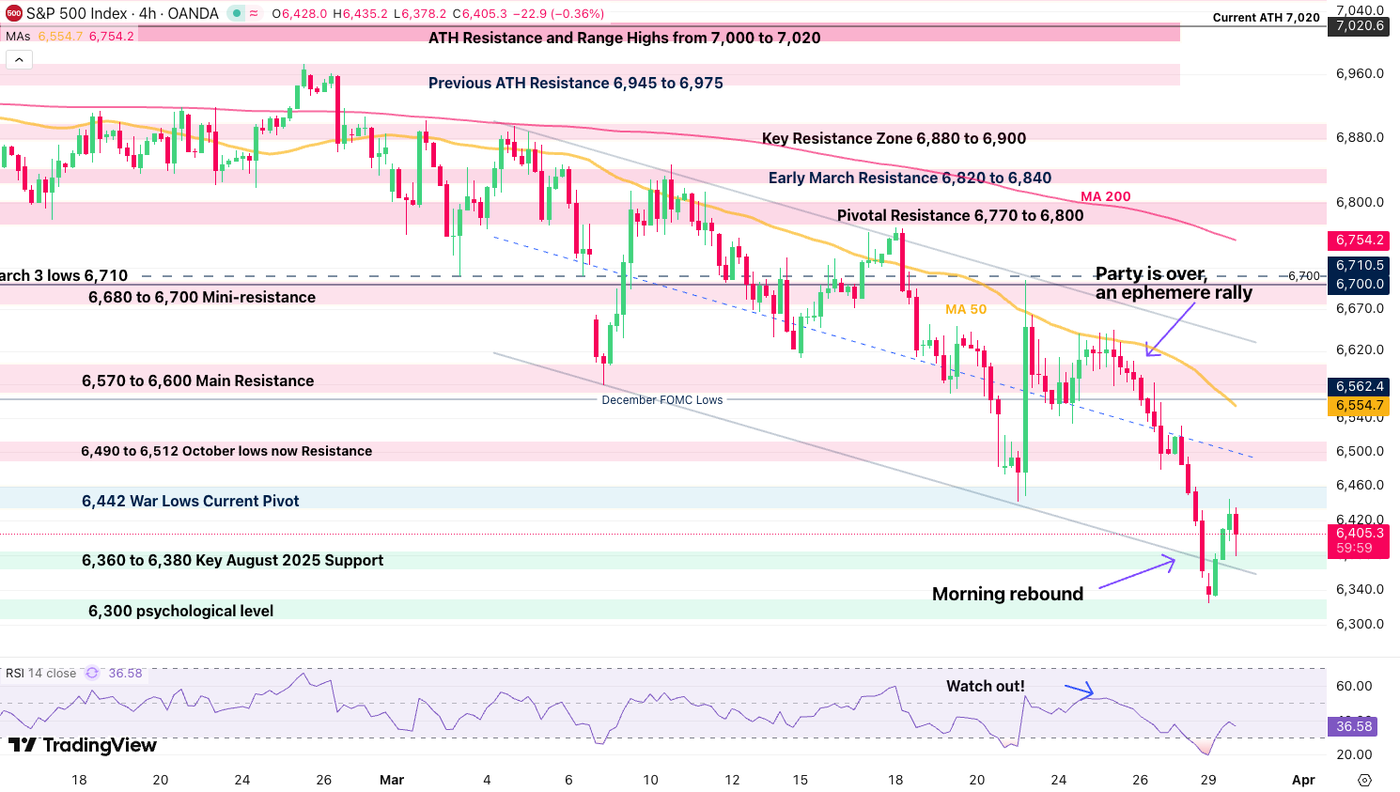
The S&P 500 is now grinding to break its War downtrend, officially having done so for now but will have to confirm on Wednesday’s open, in a similar condition as the Nasdaq.
- Currently testing the key 6,610 level (failed double-bottom from the War drop), bulls will want to see a clear extension above to reconfirm a prolonged rebound
- Rejecting back below 6,600 puts the bears back into control (return in the bear channel)
S&P 500 technical levels of interest:
Resistance Levels
- 6,580 to 6,610 Main Resistance (testing)
- 6,680 to 6,700 Mini-resistance
- 6,740 Key intraday resistance
- Pivotal Resistance 6,770 to 6,800
Support Levels
- 6,490 to 6,520 October lows Pivot
- 6,442 Past week dip
- 6,360 to 6,380 Key August 2025 Support & Channel Lows
- 6,300 psychological level (War lows)
- January 2025 ATH 6,152
Safe Trades and a Successful Week!
Follow Elior on Twitter/X for Additional Market News, interactions and Insights @EliorManier
Opinions are the authors’; not necessarily that of OANDA Business Information & Services, Inc. or any of its affiliates, subsidiaries, officers or directors. The provided publication is for informational and educational purposes only.
If you would like to reproduce or redistribute any of the content found on MarketPulse, an award winning forex, commodities and global indices analysis and news site service produced by OANDA Business Information & Services, Inc., please refer to the MarketPulse Terms of Use.
Visit https://www.marketpulse.com/ to find out more about the beat of the global markets.
© 2026 OANDA Business Information & Services Inc.
About the Author

Elior Manier
Market Analyst
Elior brings over seven years of experience in financial markets to our analyst team. Since 2018, he has actively engaged in observing, charting, and trading, driven by his passion for mastering market dynamics. With a profound understanding of the geopolitical and macroeconomic forces that shape market movements, Elior focuses on analysing the impact of breaking news, market sentiment, and critical economic data releases on trading flows.
As a versatile analyst, he contributes powerful insights to the team, effectively integrating geopolitical and technical analysis to provide clear and comprehensive market perspectives.
Prior to joining our team, Elior honed his expertise as a Fixed Income Trader and Market Analyst at the Montreal Exchange.


![i’m-nervous,-too!-[part-2]](https://10xwealthreport.com/wp-content/uploads/2026/03/177042-im-nervous-too-part-2-1568x784.jpg)