
Thinking about what to do with your Airbnb shares, or whether now is the time to buy in? You are not alone. Over the past year, Airbnb’s stock price has kept investors guessing, with a slight dip of 0.4% in the last week but a modest rebound of 3.5% over the past month. While the stock sits below its levels from a year ago, down 7.1%, those who have held for three years have still enjoyed gains of 17.4%. These moves hint at shifting investor perceptions about growth opportunity and risk, as the company adapts to longer-term changes in the travel landscape.
Recently, Airbnb has made headlines with several new features designed to attract more hosts, along with expanded partnerships that could open up entirely new streams of revenue. These efforts have caught Wall Street’s attention, suggesting that the company is focused on maintaining its competitive edge just as travel patterns keep evolving. At the same time, broader market uncertainty has added a measure of caution, which can be seen in some of the choppiness in Airbnb’s share price.
When it comes to valuation, it is not just about today’s excitement or investors’ fears. Based on six different financial checks commonly used to spot undervalued companies, Airbnb scores a 4 out of 6. That means the company looks undervalued on four of these key measures, an encouraging signal but not the whole story. If you are wondering how analysts arrive at that score, let’s break down the main valuation methods and see where Airbnb stands. And stay tuned for the end of this article, where we will explore an even smarter way to think about what Airbnb is truly worth.
Why Airbnb is lagging behind its peers
Approach 1: Airbnb Discounted Cash Flow (DCF) Analysis
A Discounted Cash Flow (DCF) model estimates the value of a company by forecasting its future cash flows and discounting them back to today’s value. This approach focuses on Airbnb’s projected ability to generate free cash for shareholders, based on its underlying business fundamentals.
Currently, Airbnb’s Free Cash Flow stands at $4.3 Billion. Analysts provide projections for the next five years, estimating steady growth. By the end of 2029, Free Cash Flow is forecasted to reach approximately $6.8 Billion. Beyond that period, future figures are extrapolated to estimate long-term potential, relying on reasonable growth rates.
Using the 2 Stage Free Cash Flow to Equity DCF model, Airbnb’s intrinsic value comes out to $209.93 per share. Compared to the current market price, this valuation suggests the stock is trading at a 39% discount, implying that shares are significantly undervalued based on this key fundamental model.
Result: UNDERVALUED
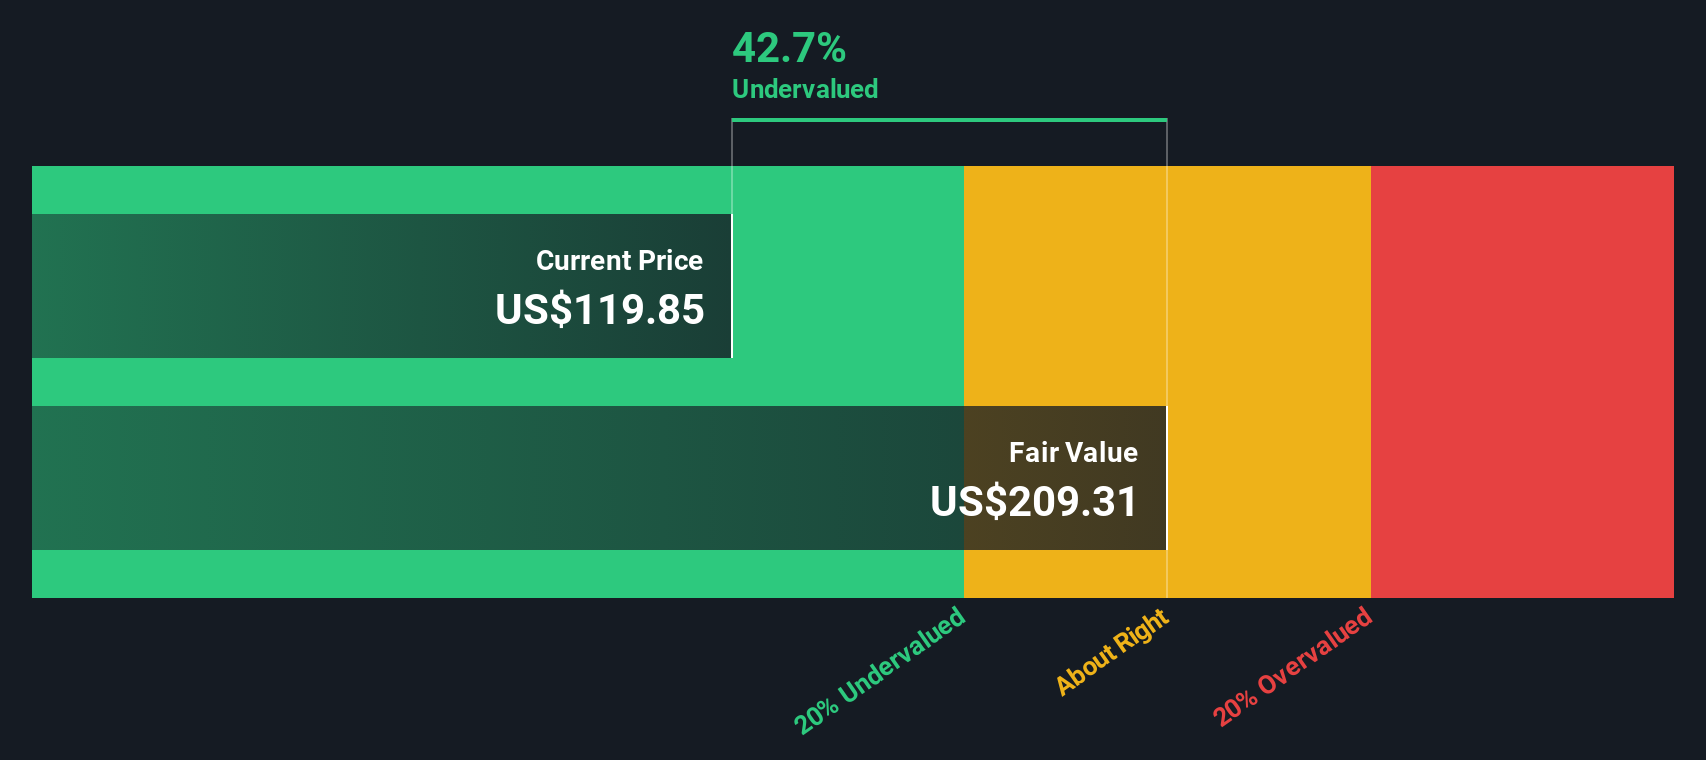
Our Discounted Cash Flow (DCF) analysis suggests Airbnb is undervalued by 39.0%. Track this in your watchlist or portfolio, or discover more undervalued stocks.
Approach 2: Airbnb Price vs Earnings (PE)
The price-to-earnings (PE) ratio is a widely recognized way to value established, profitable companies like Airbnb. It tells investors how much they are paying for each dollar of a company’s earnings, making it a reliable, quick comparison across competitors in the market. For businesses with consistent profits, the PE ratio reflects both current performance and market expectations about future growth.
However, what is considered a “normal” or “fair” PE ratio is not set in stone. It hinges on factors like how fast a company is expected to grow, how stable its earnings are, and the level of risk investors are taking on. Growth stocks or those with more predictable earnings typically command higher PE ratios, while those with more risk or slower growth trade at lower multiples.
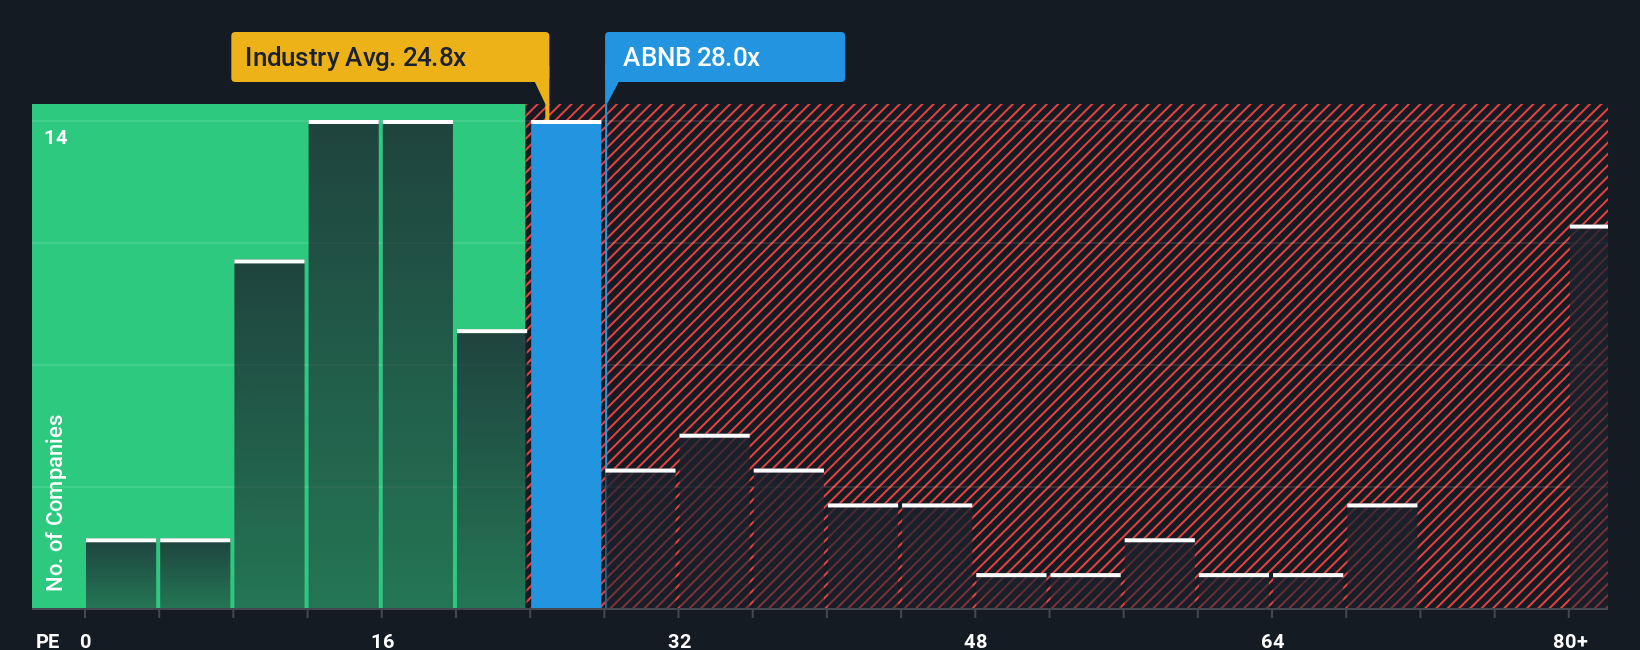
As of now, Airbnb trades at a PE ratio of 29.86x. This is just below the peer average of 30.55x, and noticeably higher than the hospitality industry average of 23.89x. But these benchmarks cannot tell the whole story. That is where Simply Wall St’s “Fair Ratio” comes in. This proprietary metric takes into account not just industry averages or competitor multiples but also Airbnb’s growth prospects, profit margins, size, and company-specific risks. For Airbnb, the Fair Ratio is 31.10x. Because Airbnb’s actual PE multiple and its Fair Ratio are so close, less than a tenth of a point apart, it suggests the market is pricing the company about right based on its fundamentals and sector outlook.
Result: ABOUT RIGHT
PE ratios tell one story, but what if the real opportunity lies elsewhere? Discover companies where insiders are betting big on explosive growth.
Upgrade Your Decision Making: Choose your Airbnb Narrative
Earlier we mentioned that there is an even better way to understand valuation, so let’s introduce you to Narratives. A Narrative is an investor’s way of connecting the story they believe about a company, such as its future growth, profits, and risks, to specific numbers like fair value and projected earnings. This creates a clear bridge between outlook and math.
Narratives bring context to the numbers by making your opinion about the company explicit. They translate your expectations about metrics like future revenue or profit margin into a fair value, and then show how that compares to today’s share price. Simply Wall St makes this process easy and interactive, allowing you to explore and build Narratives directly within the Community page, where millions of investors already share their perspectives and insights.
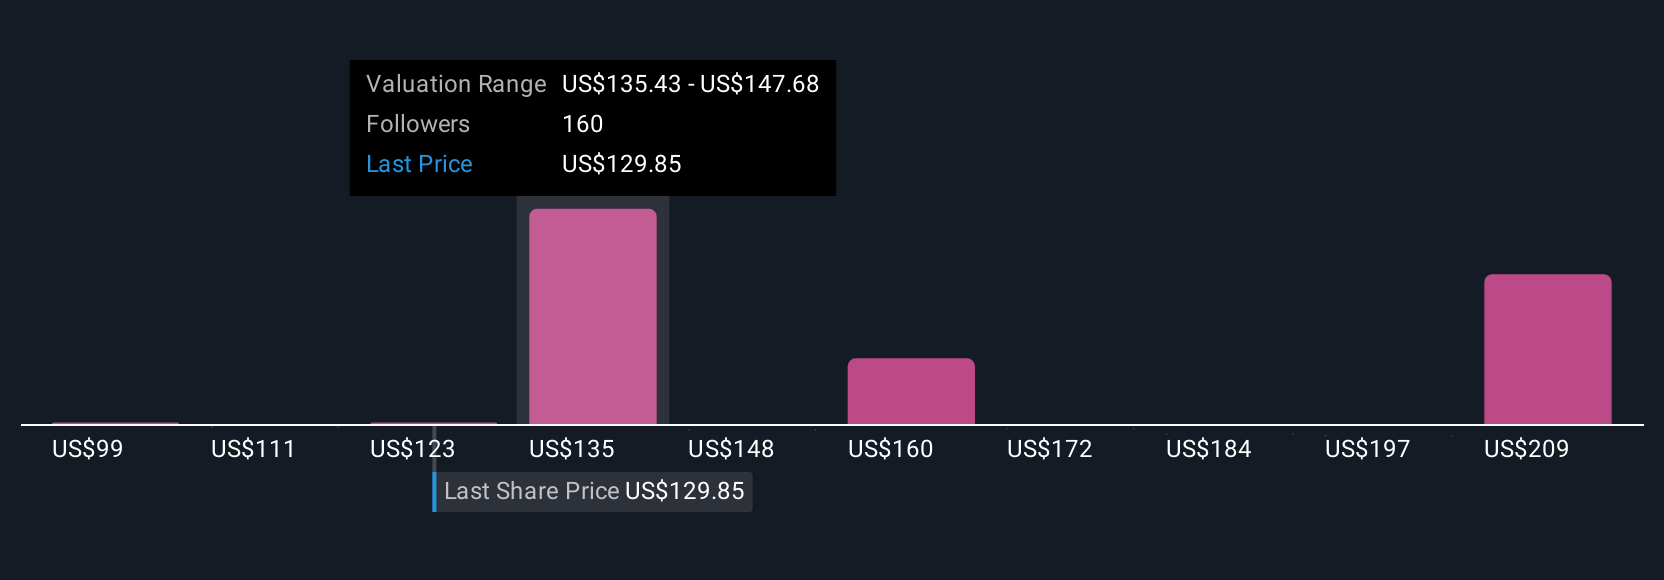
What makes Narratives so helpful is that they automatically update as fresh news, quarterly results, or new trends come in, so your investment thinking stays relevant and up to date without any hassle. For example, one investor’s Narrative for Airbnb, reflecting a bullish view driven by international growth, might show a fair value of $181. A more cautious outlook, focused on regulatory risk, values the stock closer to $98. Narratives let you see these differences side by side and guide your own buy or sell decisions with clarity and confidence.
Do you think there’s more to the story for Airbnb? Create your own Narrative to let the Community know!
This article by Simply Wall St is general in nature. We provide commentary based on historical data and analyst forecasts only using an unbiased methodology and our articles are not intended to be financial advice. It does not constitute a recommendation to buy or sell any stock, and does not take account of your objectives, or your financial situation. We aim to bring you long-term focused analysis driven by fundamental data. Note that our analysis may not factor in the latest price-sensitive company announcements or qualitative material. Simply Wall St has no position in any stocks mentioned.
New: Manage All Your Stock Portfolios in One Place
We’ve created the ultimate portfolio companion for stock investors, and it’s free.
• Connect an unlimited number of Portfolios and see your total in one currency
• Be alerted to new Warning Signs or Risks via email or mobile
• Track the Fair Value of your stocks
Have feedback on this article? Concerned about the content? Get in touch with us directly. Alternatively, email editorial-team@simplywallst.com


![i’m-nervous,-too!-[part-2]](https://10xwealthreport.com/wp-content/uploads/2026/03/177042-im-nervous-too-part-2-1568x784.jpg)