Although stock market volatility has been a common theme under President Donald Trump, Wall Street’s major indexes have thrived during his time in the Oval Office.
In his first, non-consecutive term, the ageless Dow Jones Industrial Average (^DJI 1.05%), benchmark S&P 500 (^GSPC 0.43%), and innovation-inspired Nasdaq Composite (^IXIC 0.92%) gained 57%, 70%, and 142%, respectively. Since his second-term inauguration on Jan. 20, 2025, the Dow, S&P 500, and Nasdaq Composite have delivered an encore performance, with respective gains of 14%, 15%, and 17%, through Feb. 20, 2026.
While seemingly everything has gone right for Wall Street under Trump — interest rates are coming down, inflation has eased since the summer of 2022, corporate earnings are better than expected, and the artificial intelligence (AI) revolution is boosting equity valuations — headwinds are quietly piling up. It begs the question: Could a stock market crash materialize with Donald Trump in the White House?

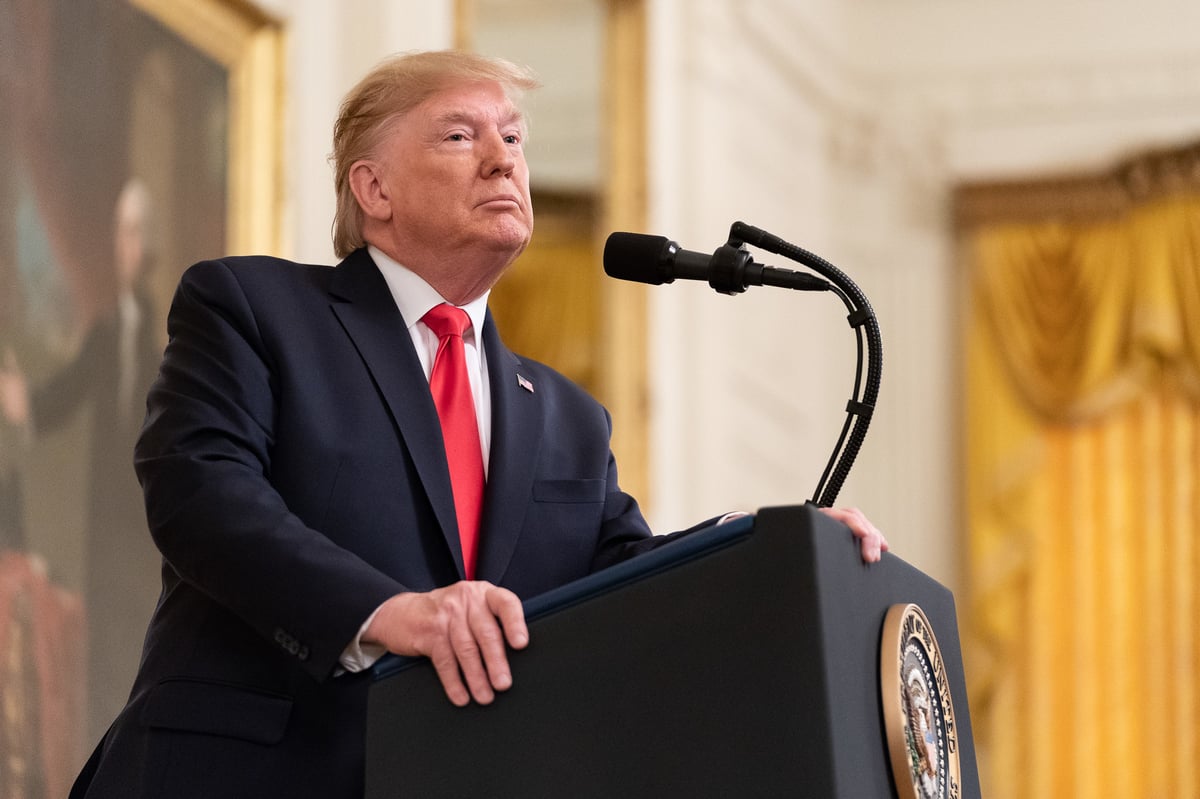
President Trump delivering remarks. Image source: Official White House Photo by Shealah Craighead, courtesy of the National Archives.
Though investors might be tempted to blame the president’s tariff and trade policy as a potential downside catalyst for Wall Street, three other factors are far more likely to send the Dow, S&P 500, and Nasdaq Composite over their tipping point, if a stock market crash does occur.
The historical priciness of stocks is a major hurdle
The first factor that’s far more likely to trigger an elevator-down move for stocks than Trump’s tariff policy is the historical priciness of equities.
To state the obvious: value is subjective. What you believe to be pricey may be viewed as a bargain by another investor. The lack of a one-size-fits-all blueprint for evaluating stocks is why short-term price movements are so unpredictable.
However, the S&P 500’s Shiller Price-to-Earnings (P/E) Ratio, also known as the Cyclically Adjusted P/E Ratio (CAPE Ratio), cuts directly through this subjectivity and provides investors with apples-to-apples valuation comparisons for the broader market when looking back 155 years.
Whereas the traditional P/E ratio is arrived at by using trailing 12-month earnings and can be easily tripped up by a recession or shock event, the Shiller P/E is based on average inflation-adjusted earnings over the previous decade. Examining 10 years of earnings history means short-lived recessions and shock events won’t diminish the usefulness of this valuation tool.
S&P 500 Shiller PE Ratio hits 2nd highest level in history 🚨 The highest was the Dot Com Bubble 🤯 pic.twitter.com/Lx634H7xKa
— Barchart (@Barchart) December 28, 2025
Since January 1871, the Shiller P/E has averaged approximately 17.3. But over the last three months, this valuation yardstick has danced between 39 and 41, marking the second-priciest stock market in history.
Over the last 155 years, there have been just six instances in which the CAPE Ratio topped 30, including the present. The previous five occurrences were all eventually followed by 20% or greater declines in one or more of Wall Street’s major stock indexes.
In other words, stock valuations are extended to the upside, and history tells us they’re unlikely to remain extended over the long term.
History teaches us that all game-changing technology bubbles burst
A second catalyst with a much better chance than tariff worries to pull the rug out from beneath investors is a potential AI bubble-bursting event.
Roughly three decades ago, the advent and proliferation of the internet reshaped corporate America and the investment landscape. The internet opened new sales and marketing doors for businesses, and it broke down barriers between Wall Street and Main Street that had been in place for more than a century.
But while adoption of the internet was swift, it took well over half a decade before businesses understood how to optimize this technology to maximize sales and profits. Lofty investor expectations not being met is what led to the dot-com bubble, which saw the S&P 500 and Nasdaq Composite lose 49% and 78%, respectively.

Image source: Getty Images.
Every hyped trend and game-changing technology that’s followed has navigated the same path, albeit on different timelines. Without fail, investors have overestimated the adoption and/or optimization of a next-big-thing trend, eventually leading to a bubble-bursting event.
Like the internet, AI hasn’t struggled with adoption. Businesses have been spending aggressively on AI infrastructure. However, these same companies are a long way from optimizing AI applications and solutions to maximize sales and profits. Some of the hallmarks of previous bubble-bursting events can be seen in the rise of AI.
If history repeats and the AI bubble bursts under President Trump, a stock market crash isn’t out of the question.
Historic division within the Federal Reserve can’t be ignored
The third catalyst that’s more likely than tariff uncertainty to send the Dow Jones Industrial Average, S&P 500, and Nasdaq Composite into a tailspin is the historic division at America’s foremost financial institution, the Federal Reserve.
The Fed’s job is straightforward: it aims to maximize employment and stabilize prices. It works toward these goals by adjusting the federal funds target rate or through open market operations (e.g., buying or selling U.S. Treasury bonds). Typically, the Fed is a calming force for the stock market, especially during periods of heightened uncertainty.
However, each of the last five Federal Open Market Committee (FOMC) meetings — the FOMC is the 12-person body, including Fed Chair Jerome Powell, responsible for setting the nation’s monetary policy — has featured at least one dissenting opinion. Although investors have demonstrated a willingness to tolerate late moves by the FOMC, they dislike it when members lack a similar vision.
Anna is correct below when she says:
“I have not seen a meeting with so much contradictions.”
—
This meeting was a mess.See the labels in the dot plot below.
One member of the FOMC thinks the Fed is going to HIKE rates this year. One (Stephen Miran) thinks it is going to cut… https://t.co/TRUQmD5I2E pic.twitter.com/qPlJGL57ln
— Jim Bianco (@biancoresearch) September 17, 2025
What’s more, the October and December FOMC meetings featured dissents in opposite directions. Though the FOMC voted in favor of reducing the federal funds target rate by 25 basis points in both meetings, at least one member favored no cut, while another pushed for a 50-basis-point reduction. Only three FOMC meetings since 1990 have had dissents in opposite directions, and two have occurred over the last four months.
To complicate things, Jerome Powell’s term as Fed chair comes to an end on May 15. President Trump’s nominated replacement for Powell, Kevin Warsh, has the potential to rock the proverbial boat.
Although Warsh has experience as a former member of the FOMC, his ideology may clash with the other voting members or with Wall Street. For example, Warsh favors deleveraging the Fed’s $6.6 trillion balance sheet, primarily comprised of U.S. Treasury bonds and mortgage-backed securities (MBS). Selling these assets would likely drive up yields and, in turn, interest rates. The last thing investors want to see is higher interest/mortgage rates.
The Federal Reserve is a total wildcard that could spook the stock market in 2026.