

- US Stock Benchmarks attempt a continued rebound in the current session, with the narrative seemingly easing in recent days
- After the previous session’s stalling progress, Equities pursue their cautious rebound
- Exploring Technical Levels for the Dow Jones, Nasdaq and S&P 500
US Stock benchmarks are still attempting to price a cautious but seemingly better narrative around the Middle East conflict into another rebound in today’s session.
This continues the theme that had shaken Markets in Monday’s chaotic, but more positive weekly open: The War doesn’t seem to be taking a turn for the worse, hinting at what could really be a four to five-week-long conflict.
It would be almost too good to be true to see Donald Trump make good on his words, having announced such a deadline to the ceaseless strikes on Islamic regime targets in Iran.
The current War isn’t faring well with the American public, and right ahead of the Midterms coming up in November, the President surely doesn’t want to aggravate his case.
But during wartime, each headline has to be taken with a pinch of salt, particularly with Iran reportedly rejecting Trump’s 15-point plan to add their own demands – They are particularly keen on conserving their long-range ballistic missile capabilities, but the world knows how dangerous they have been, so expect this to be a zone of contention.
We should learn more on these developments by Friday.
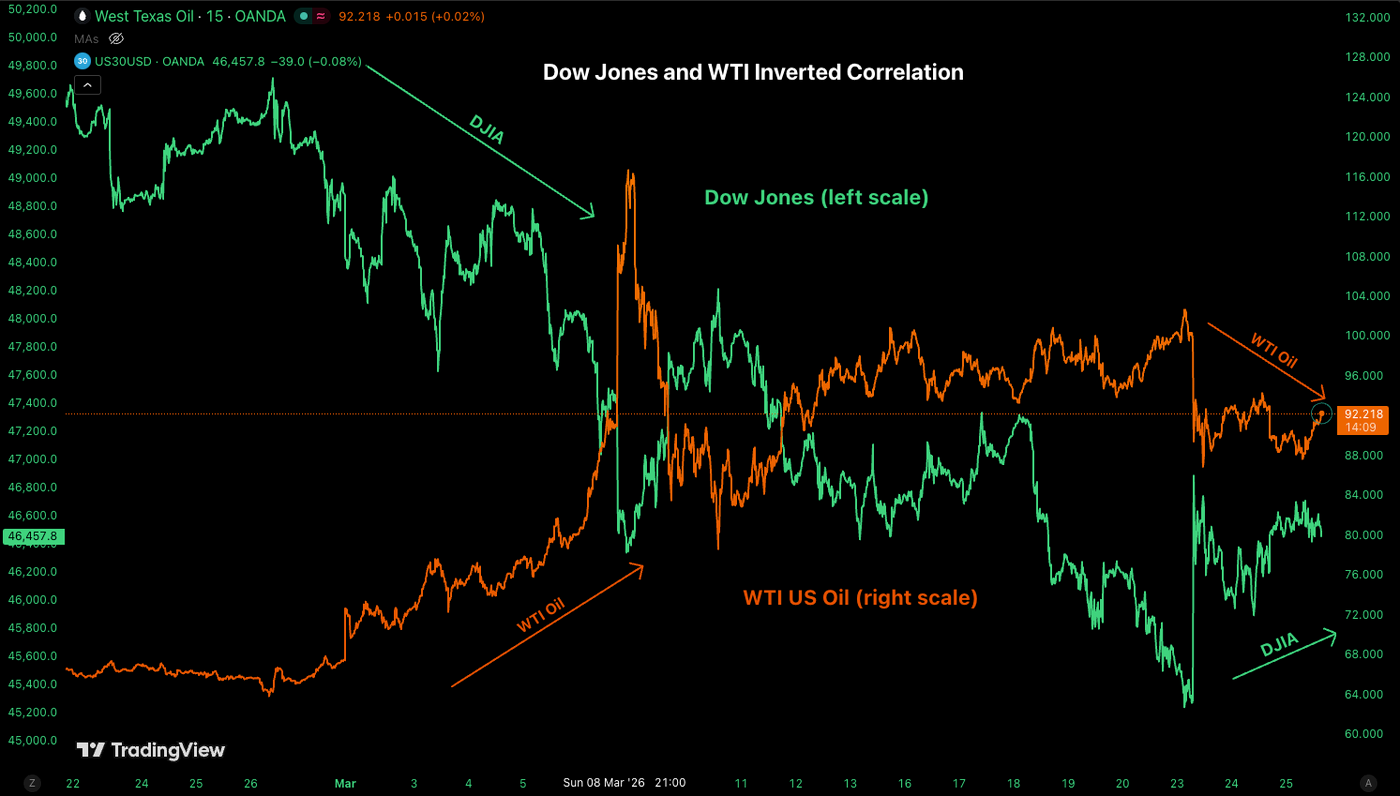
Despite all the uncertainty, traders should focus more on what is happening in front of them: The Oil-Stocks inverse correlation is the only clear Market development since the beginning of the month; Tracking the commodity will act as a guide to navigate this clouded environment (while headlines do the exact opposite).
WTI Oil had gapped lower in recent sessions and held a lower trajectory since, but has stalled its descent around the $88 Level, and this has weighed on Stock Markets since the mid-session.
(Don’t forget to check out our recent WTI Analysis to have a better guess of where Support and resistance can occur, as long as no real solution is found.
In today’s action, all Stock Indexes are moving together with no clear outperformer – See more just below.
Let’s spot where today’s cautiously optimistic price action is heading by looking at today’s intraday charts and trading levels for the major US indexes: the Dow Jones, Nasdaq, and S&P 500.
Current Session’s Stock Heatmap
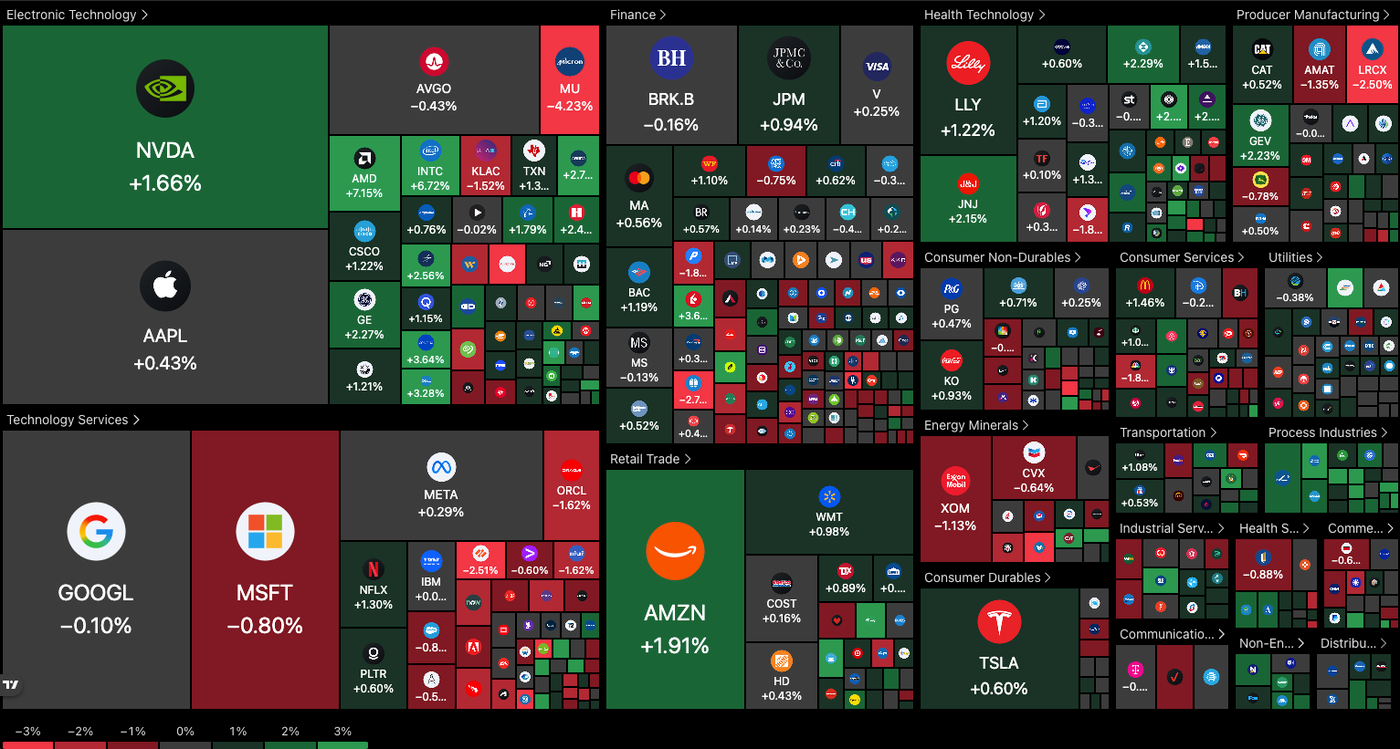
The rebound hasn’t seen formed any consistent pattern since Monday, except for the previous session’s Manufacturing outperformance – Process Industries and Pharmaceuticals are the only sectors flashing green in today’s session.
The rest is broadly chaotic, so for individual Stock traders, the best is to look for local ranges to play.
Dow Jones 4H Chart and Trading Levels
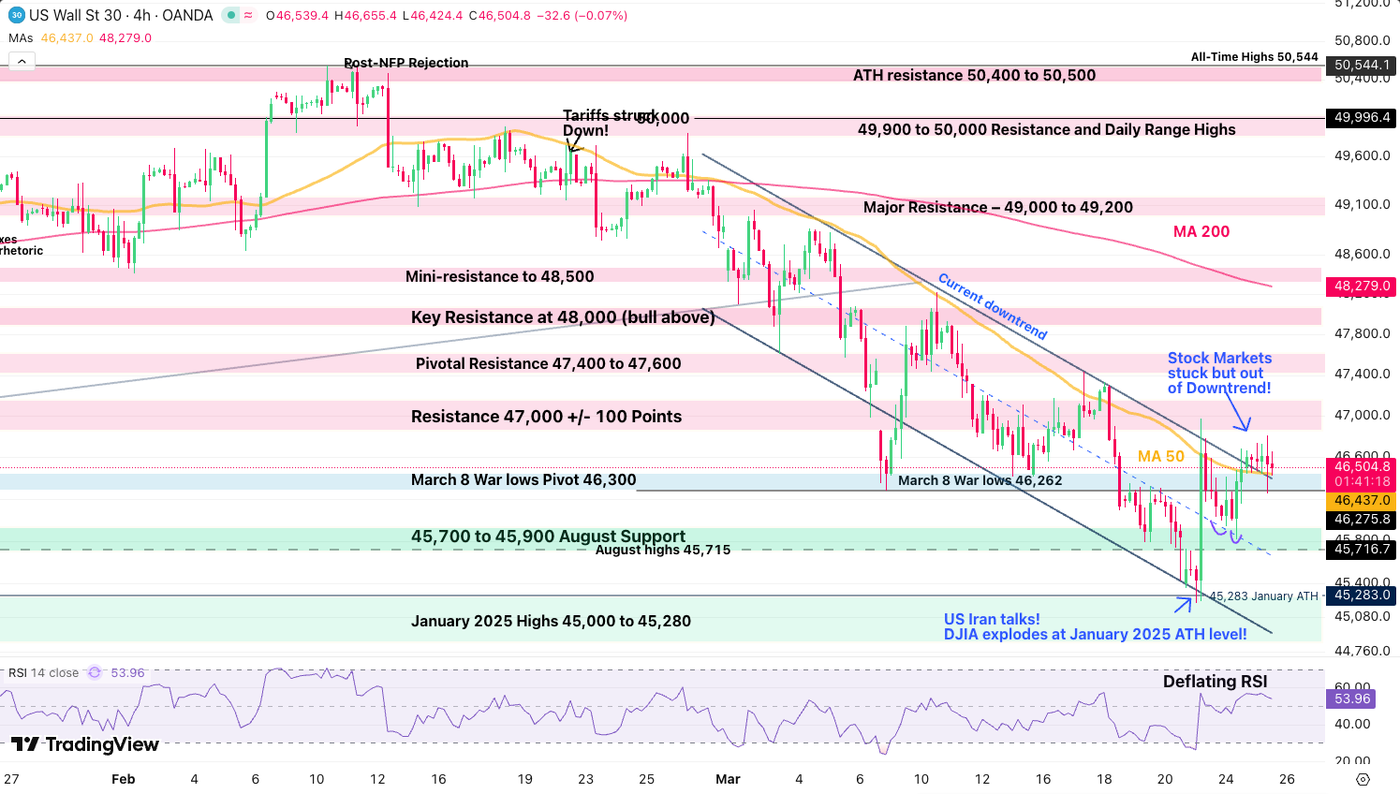
For the first time since February 26, the Dow Jones is trading above its 4H 50-period Moving Average, a striking progress particularly with the consistent downtrend that had developed since.
Combining with a weak, but persistent exit from the March bear channel, it seems that the DJIA is only a few positive headlines from a rebound – 48,000 would be a decent target in that event – Above 48,000, expect the rebound to hold towards 50,000.
The only issue is that optimism in such an environment could prove short-lasted, hence with bullish views in the Market, make sure that your size is under control to allow for more flexibility in case things turn sour again.
Any session close below 46,300 would continue the downtrend.
Dow Jones technical levels for trading:
Resistance Levels
- Resistance 47,000 +/- 100 Points (session highs and major resistance)
- Momentum Resistance 47,500 to 47,650
- Key Resistance at 48,000
- 48,400 to 48,500 mini-resistance
Support Levels
- 4H 50-period MA 46,437
- March 8 War lows Pivot 46,200 to 46,300.
- January 2025 Highs 45,000 to 45,280 (Monday lows)
Nasdaq 4H Chart and Trading Levels
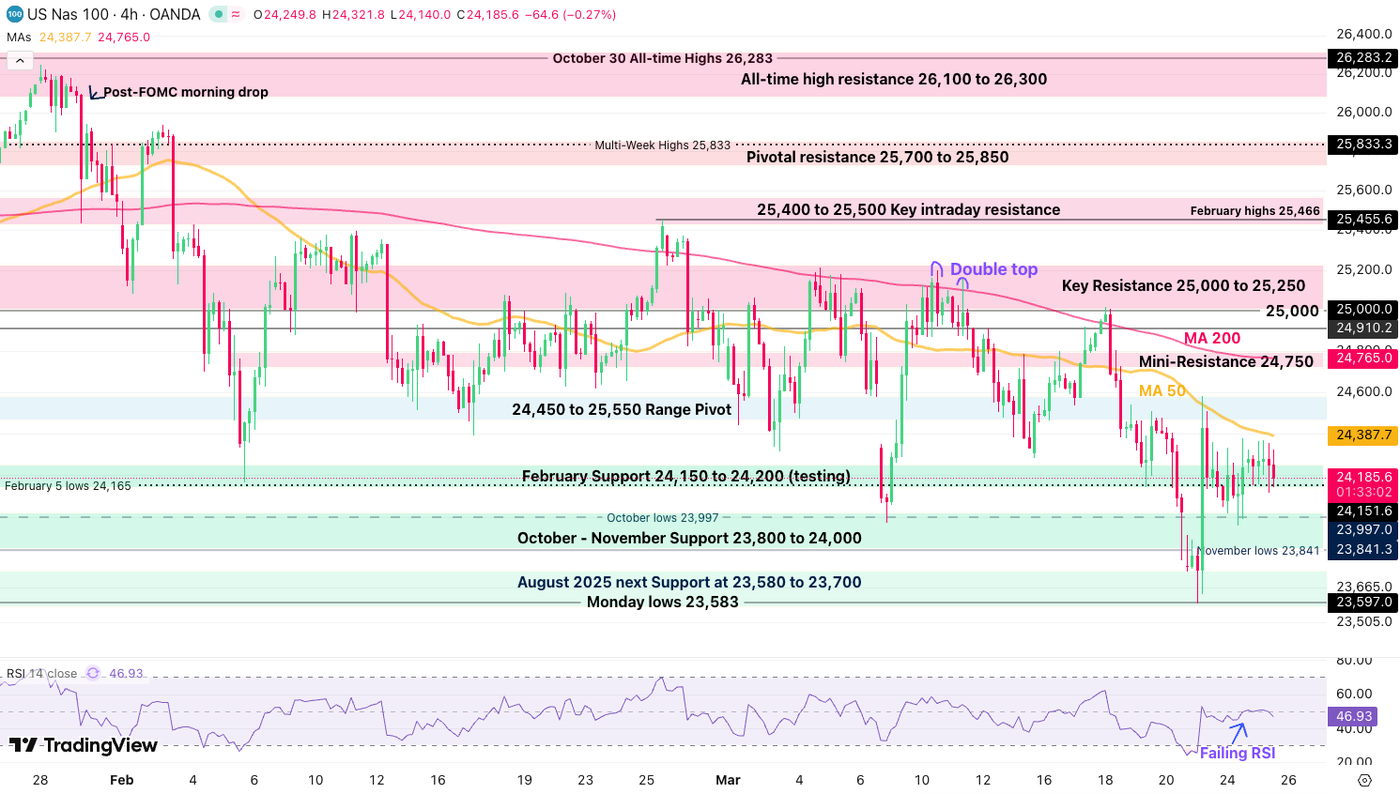
Nasdaq is actually looking more pessimistic than its elder, failing to persistently hold above 24,200 with its RSI actually turning bearish.
Breaking 24,150 could see a quick test of the 23,800 support; Even in the event of the rebound, it looks like the tech Index has less inherent strength and could lag on a rally.
Nasdaq technical levels of interest:
Resistance Levels
- 24,387 4H 50-period
- 24,450 to 25,550 Range Pivot (short-term resistance)
- Mini-intraday Resistance 24,750
- Key Resistance 25,000 to 25,200 (Range highs – Long-term Bullish above)
Support Levels
- February Support 24,150
- October – November Support 23,800 to 24,000
- Morning lows: August 2025 next Support at 23,580 to 23,700
- Early 2025 ATH at 22,000 to 22,229 Support
S&P 500 4H Chart and Trading Levels
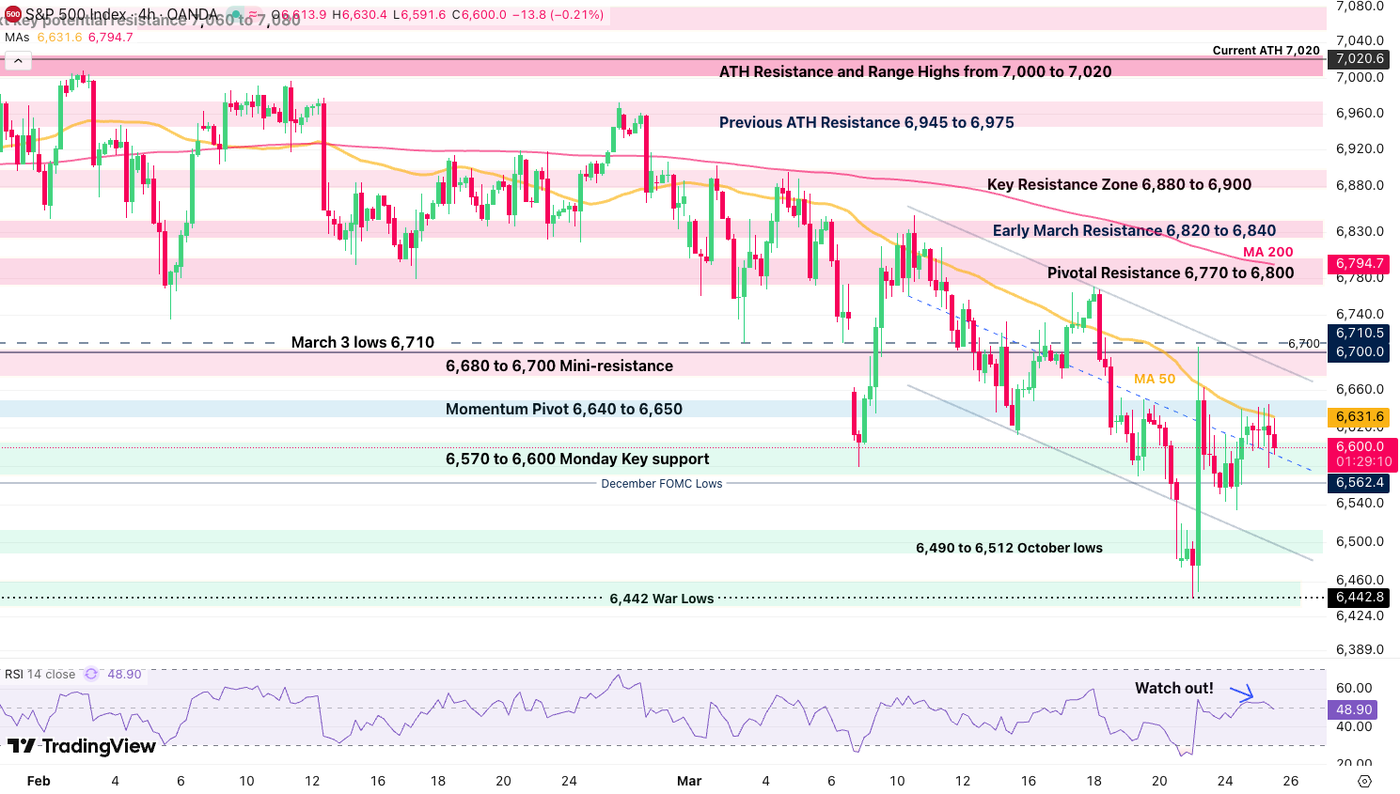
The S&P 500 looks right in the middle between bullish and bearish; it remains the Index to trade if you prefer less brutal up-and-down swings.
As long as the price action remains above 6,580, the outlook isn’t bearish, but not so bullish either:
- Buyers will want a break above 6,650 to relaunch a bullish outlook.
S&P 500 technical levels of interest:
Resistance Levels
- Momentum Pivot 6,640 to 6,650
- 6,680 to 6,700 Mini-resistance
- 6,740 Key intraday resistance
- Pivotal Resistance 6,770 to 6,800
Support Levels
- 6,570 to 6,600 Monday Key Double Bottom support
- 6,490 to 6,512 October lows
- 6,442 Morning Lows
- 6,400 Major psychological support
Safe Trades and Keep track of WTI prices!
Follow Elior on Twitter/X for Additional Market News, interactions and Insights @EliorManier
Opinions are the authors’; not necessarily that of OANDA Business Information & Services, Inc. or any of its affiliates, subsidiaries, officers or directors. The provided publication is for informational and educational purposes only.
If you would like to reproduce or redistribute any of the content found on MarketPulse, an award winning forex, commodities and global indices analysis and news site service produced by OANDA Business Information & Services, Inc., please refer to the MarketPulse Terms of Use.
Visit https://www.marketpulse.com/ to find out more about the beat of the global markets.
© 2026 OANDA Business Information & Services Inc.
About the Author

Elior Manier
Market Analyst
Elior brings over seven years of experience in financial markets to our analyst team. Since 2018, he has actively engaged in observing, charting, and trading, driven by his passion for mastering market dynamics. With a profound understanding of the geopolitical and macroeconomic forces that shape market movements, Elior focuses on analysing the impact of breaking news, market sentiment, and critical economic data releases on trading flows.
As a versatile analyst, he contributes powerful insights to the team, effectively integrating geopolitical and technical analysis to provide clear and comprehensive market perspectives.
Prior to joining our team, Elior honed his expertise as a Fixed Income Trader and Market Analyst at the Montreal Exchange.


![i’m-nervous,-too!-[part-2]](https://10xwealthreport.com/wp-content/uploads/2026/03/177042-im-nervous-too-part-2-1568x784.jpg)