
With its stock down 5.3% over the past month, it is easy to disregard HASEKO (TSE:1808). However, stock prices are usually driven by a company’s financials over the long term, which in this case look pretty respectable. In this article, we decided to focus on HASEKO’s ROE.
Return on equity or ROE is a key measure used to assess how efficiently a company’s management is utilizing the company’s capital. In other words, it is a profitability ratio which measures the rate of return on the capital provided by the company’s shareholders.
View our latest analysis for HASEKO
How Is ROE Calculated?
Return on equity can be calculated by using the formula:
Return on Equity = Net Profit (from continuing operations) ÷ Shareholders’ Equity
So, based on the above formula, the ROE for HASEKO is:
11% = JP¥56b ÷ JP¥511b (Based on the trailing twelve months to March 2024).
The ‘return’ is the amount earned after tax over the last twelve months. So, this means that for every ¥1 of its shareholder’s investments, the company generates a profit of ¥0.11.
What Is The Relationship Between ROE And Earnings Growth?
So far, we’ve learned that ROE is a measure of a company’s profitability. We now need to evaluate how much profit the company reinvests or “retains” for future growth which then gives us an idea about the growth potential of the company. Assuming everything else remains unchanged, the higher the ROE and profit retention, the higher the growth rate of a company compared to companies that don’t necessarily bear these characteristics.
HASEKO’s Earnings Growth And 11% ROE
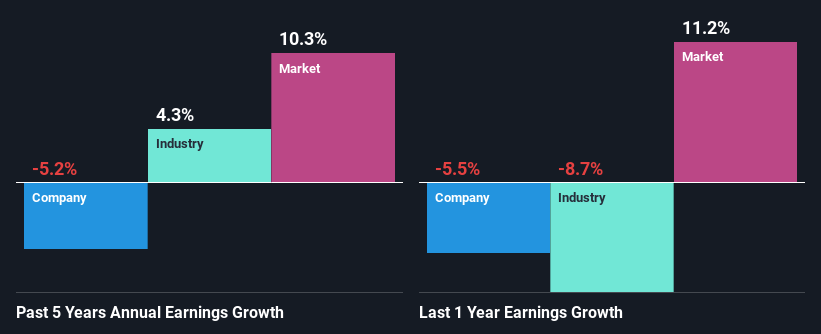
To begin with, HASEKO seems to have a respectable ROE. Further, the company’s ROE compares quite favorably to the industry average of 6.0%. For this reason, HASEKO’s five year net income decline of 5.2% raises the question as to why the high ROE didn’t translate into earnings growth. We reckon that there could be some other factors at play here that are preventing the company’s growth. These include low earnings retention or poor allocation of capital.
However, when we compared HASEKO’s growth with the industry we found that while the company’s earnings have been shrinking, the industry has seen an earnings growth of 4.3% in the same period. This is quite worrisome.
The basis for attaching value to a company is, to a great extent, tied to its earnings growth. It’s important for an investor to know whether the market has priced in the company’s expected earnings growth (or decline). By doing so, they will have an idea if the stock is headed into clear blue waters or if swampy waters await. One good indicator of expected earnings growth is the P/E ratio which determines the price the market is willing to pay for a stock based on its earnings prospects. So, you may want to check if HASEKO is trading on a high P/E or a low P/E, relative to its industry.
Is HASEKO Using Its Retained Earnings Effectively?
In spite of a normal three-year median payout ratio of 37% (that is, a retention ratio of 63%), the fact that HASEKO’s earnings have shrunk is quite puzzling. So there could be some other explanations in that regard. For instance, the company’s business may be deteriorating.
Moreover, HASEKO has been paying dividends for at least ten years or more suggesting that management must have perceived that the shareholders prefer dividends over earnings growth.
Summary
In total, it does look like HASEKO has some positive aspects to its business. Yet, the low earnings growth is a bit concerning, especially given that the company has a high rate of return and is reinvesting ma huge portion of its profits. By the looks of it, there could be some other factors, not necessarily in control of the business, that’s preventing growth. With that said, we studied the latest analyst forecasts and found that while the company has shrunk its earnings in the past, analysts expect its earnings to grow in the future. To know more about the latest analysts predictions for the company, check out this visualization of analyst forecasts for the company.
Valuation is complex, but we’re helping make it simple.
Find out whether HASEKO is potentially over or undervalued by checking out our comprehensive analysis, which includes fair value estimates, risks and warnings, dividends, insider transactions and financial health.
Have feedback on this article? Concerned about the content? Get in touch with us directly. Alternatively, email editorial-team (at) simplywallst.com.
This article by Simply Wall St is general in nature. We provide commentary based on historical data and analyst forecasts only using an unbiased methodology and our articles are not intended to be financial advice. It does not constitute a recommendation to buy or sell any stock, and does not take account of your objectives, or your financial situation. We aim to bring you long-term focused analysis driven by fundamental data. Note that our analysis may not factor in the latest price-sensitive company announcements or qualitative material. Simply Wall St has no position in any stocks mentioned.


![i’m-nervous,-too!-[part-2]](https://10xwealthreport.com/wp-content/uploads/2026/03/177042-im-nervous-too-part-2-1568x784.jpg)