
📉 The stock market fell, with the S&P 500 shedding 1% last week to close at 5,954.50. It’s now up 1.2% year to date and up 66.5% from its October 12, 2022 closing low of 3,577.03. For more on market moves, read: Investing in the stock market is an unpleasant process 📉
–
When the stock market falls more than 1% in a day or a couple percentage points over a couple of days, I always get the feeling that it’s the beginning of a much bigger sell-off.
This has been consistent in my 19 years of writing about stocks. To be fair, it’s a rational feeling to have because stock market history is riddled with big, lengthy sell-offs. And you can be sure there’ll be big sell-offs, including bear markets, in the years to come.
That said, something that has changed over the years is my growing familiarity with the data, which has made me a better investor less prone to making emotionally-driven adjustments to my portfolio.
Just last week, I learned something fascinating from a Bespoke Investment Group blog post:
Emotions and investing don’t mix. Emotional investors tend to sell when the market is going down and buy when the market is going up. They should be doing the opposite. As shown below, if you only owned the U.S. stock market on the day after up days since SPY began trading in 1993, your cumulative gain would be just 44%. If you only owned the market on the day after down days, you’d be up 851%!
The chart is stupefying.

Sure, buy-and-hold clearly dominates. And owning only on the days after up days still came with a positive return.
But owning only on the days after declines — which are the days many investors usually feel less bullish — have produced returns that eclipse owning only on days after up days.
We’ve already talked about how the best days in the stock market come at the worst times. Nevertheless, I was surprised to see how strong the returns were if you had only held on the day after all of the down days.
This is helpful to know, especially since the odds of a down day in the stock market are relatively high at 47%. This is is why the stock market gets so much negative daily news coverage. If we only got stock market news monthly, quarterly, or annually, the odds of seeing positive stories would be much higher.
And before you think about overhauling your investment process to only own the day after down days, keep in mind that buy-and-hold was still the winning strategy.
(By the way, this whole discussion is similar to what we know about how the stock market performs under various presidents. You might assume the stock market outperforms when a Republican sits in the Oval Office. In fact, the opposite is true: The market outperforms slightly when a Democrat is president. But again, owning stocks only when a certain party occupies the White House has been a mistake. Returns have been multitudes higher when you’ve held stocks through both Republican and Democrat presidencies.)
Make no mistake. We very well could be on the precipice of a bigger pullback.
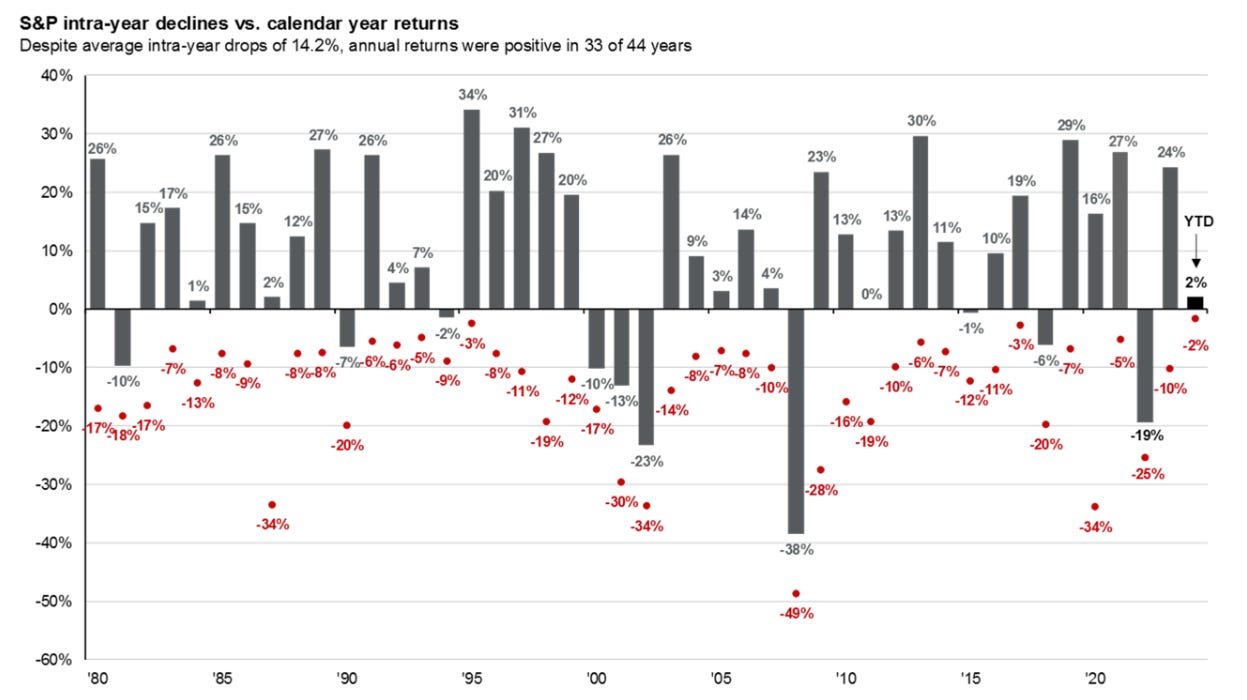
The S&P 500 has historically experienced an intra-year max drawdown of 14%. From Feb. 19’s high of 6,147, the index fell 5% to a low of 5,837 on Friday. It would have to fall to 5,286 for that average move. That’s an 11% decline from Friday’s close.
That said, it’s also likely that we don’t experience a decline of that magnitude in the near-term — the stock market usually goes up.
Even if we were near some top, it’s incredibly difficult to time buys and sells to make trading the top make sense.
All that is to say that the best strategy for long-term investors is to hold and stand fast through what could be a big downturn. As they say, time in the market beats timing the market.
Investing in the stock market is an unpleasant process. The best you can do is to have clear goals and a thoughtful strategy based on your needs and timeline. And from there, you just keep your stock market seatbelts fastened.
–
Related from TKer:
-
The best days in the stock market come at the worst times 📉🚀
-
The stat explaining why the stock market gets so much negative news coverage 📺
-
On presidents, the stock market, and the big picture for investors 🖼
-
BofA: ‘Q: Is it better to sell early or late? A: Neither.’ ⏰
-
Smart people agree that the best investing wisdom shares a common theme 🧐
There were several notable data points and macroeconomic developments since our last review:
🏭 Business investment activity rises. Orders for nondefense capital goods excluding aircraft — a.k.a. core capex or business investment — rose 0.8% to a record $75.1 billion in January.

Core capex orders are a leading indicator, meaning they foretell economic activity down the road. The growth rate had leveled off a bit, but they’ve perked up in recent months.
For more on core capex, read: A bullish business investment story is brewing 🏭 and ‘Check yourself’ as the data zig zags ↯
🎈 Inflation trends are cool. The personal consumption expenditures (PCE) price index in January was up 2.5% from a year ago, down from December’s 2.6% rate. The core PCE price index — the Federal Reserve’s preferred measure of inflation — was up 2.6% during the month, near its lowest level since March 2021.
On a month over month basis, the core PCE price index was up 0.3%. If you annualized the rolling three-month and six-month figures, the core PCE price index was up 2.4% and 2.6%, respectively.
Inflation rates continue to hover near the Federal Reserve’s target rate of 2%, which has given the central bank the flexibility to cut rates as it addresses other developing issues in the economy.
For more on inflation and the outlook for monetary policy, read: The Fed closes a chapter with a rate cut ✂️ and The other side of the Fed’s inflation ‘mistake’ 🧐
🛍️ Consumer spending cools. According to BEA data, personal consumption expenditures declined 0.2% month over month in January to an annual rate of $20.4 trillion.

Adjusted for inflation, real personal consumption expenditures fell by 0.5%.

For more on consumer spending, read: Americans have money, and they’re spending it 🛍️ and 9 once-hot economic charts that cooled 📉
💳 Card spending data is holding up. From JPMorgan: “• As of 21 Feb 2025, our Chase Consumer Card spending data (unadjusted) was 0.1% above the same day last year. Based on the Chase Consumer Card data through 21 Feb 2025, our estimate of the US Census February control measure of retail sales m/m is 0.20%.”

From BofA: “Total card spending per HH was down 0.9% y/y in the week ending Feb 22, according to BAC aggregated credit & debit card data. Relative to the week ending Feb 15, the biggest slowdowns were in entertainment, transit and furniture. Spending growth was strong in the West, but weak in other regions. This suggests winter weather likely disrupted spending.“

For more on the consumer, read: Americans have money, and they’re spending it 🛍️
👎 Consumer vibes deteriorate. The Conference Board’s Consumer Confidence Index ticked lower in February. From the firm’s Stephanie Guichard: “In February, consumer confidence registered the largest monthly decline since August 2021. This is the third consecutive month on month decline, bringing the Index to the bottom of the range that has prevailed since 2022. Of the five components of the Index, only consumers’ assessment of present business conditions improved, albeit slightly. Views of current labor market conditions weakened. Consumers became pessimistic about future business conditions and less optimistic about future income. Pessimism about future employment prospects worsened and reached a ten-month high.“
“Consumers’ Perceived Likelihood of a U.S. Recession over the Next 12 Months rose in February.”
Relatively weak consumer sentiment readings appear to contradict resilient consumer spending data. For more on this contradiction, read: What consumers do > what consumers say 🙊 and We’re taking that vacation whether we like it or not 🛫
👎 Consumers feel worse about the labor market. From The Conference Board’s February Consumer Confidence survey: “Consumers’ views of the labor market were less positive in February. 33.4% of consumers said jobs were ‘plentiful,’ down from 33.9% in January. 16.3% of consumers said jobs were ‘hard to get,’ up from 14.5%.”
Many economists monitor the spread between these two percentages (a.k.a., the labor market differential), and it’s been reflecting a cooling labor market.

For more on the labor market, read: The labor market is cooling 💼
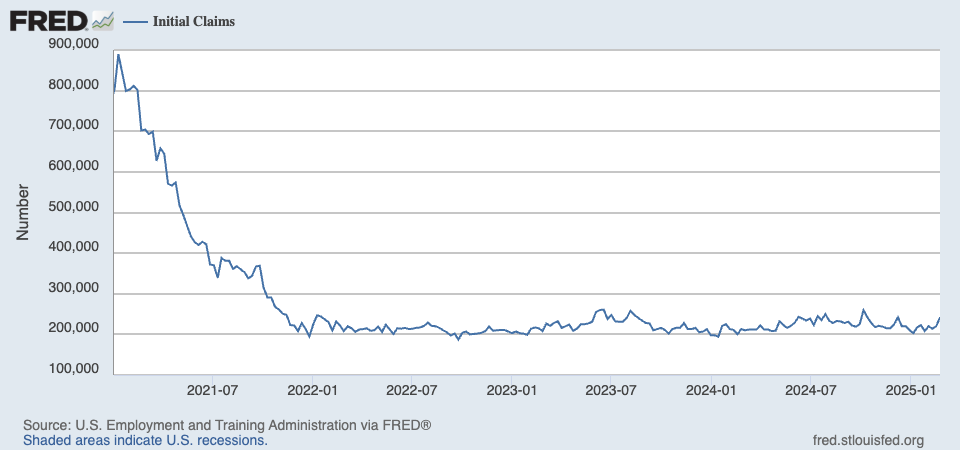
💼 Unemployment claims rise. Initial claims for unemployment benefits increased to 242,000 during the week ending February 22, up from 220,000 the week prior. This metric continues to be at levels historically associated with economic growth.
For more on the labor market, read: The labor market is cooling 💼
⛽️ Gas prices tick lower. From AAA: “With winter nearly in the rearview, temperatures warmed up while gas prices cooled down. This week, gas prices dropped by three cents, bringing the national average to $3.12 per gallon. … According to new data from the Energy Information Administration (EIA), gasoline demand increased from 8.23 million b/d last week to 8.45. Total domestic gasoline supply increased from 247.9 million barrels to 248.3, while gasoline production decreased last week, averaging 9.2 million barrels per day.”
For more on energy prices, read: Higher oil prices meant something different in the past 🛢️
🏠 Mortgage rates tick lower. According to Freddie Mac, the average 30-year fixed-rate mortgage declined to 6.76% from 6.85% last week. From Freddie Mac: “This week, mortgage rates decreased to their lowest level in over two months. The drop in mortgage rates, combined with modestly improving inventory, is an encouraging sign for consumers in the market to buy a home.”
There are 147 million housing units in the U.S., of which 86.6 million are owner-occupied and 34 million (or 40%) of which are mortgage-free. Of those carrying mortgage debt, almost all have fixed-rate mortgages, and most of those mortgages have rates that were locked in before rates surged from 2021 lows. All of this is to say: Most homeowners are not particularly sensitive to movements in home prices or mortgage rates.
For more on mortgages and home prices, read: Why home prices and rents are creating all sorts of confusion about inflation 😖
🏠 Home prices rise. According to the S&P CoreLogic Case-Shiller index, home prices rose 0.5% month-over-month in December. From S&P Dow Jones Indices’ Brian Luke: “National home prices have risen by 8.8% annually since 2020, led by markets in Florida, North Carolina, Southern California, and Arizona. While our National Index continues to trend above inflation, we are a few years removed from peak home price appreciation of 18.9% observed in 2021 and are seeing below-trend growth over the history of the index. … Through this recent market cycle, the ability of Americans to grow wealth by participating in the upside of the U.S. housing market, particularly if done through a leveraged position by securing a mortgage, has proven to be historically beneficial.”
🏘️ New home sales fall. Sales of newly built homes fell 10.5% in January to an annualized rate of 657,000 units.
🏢 Offices remain relatively empty. From Kastle Systems: “Peak day office occupancy was 60.8% on Tuesday last week, down four tenths of a point from the previous week. In Washington, D.C., Chicago, and Philadelphia, Wednesday occupancy rose significantly after last week’s winter weather, increasing 35.7 points to 59.6%, 21.5 points to 65.5%, and 12.8 points to 50.5%, respectively. In Dallas, the effects of winter weather caused Wednesday occupancy to fall more than 20 points to 49.7%. The average low was on Friday at 32.5%, down 3.9 points from last week.”
For more on office occupancy, read: This stat about offices reminds us things are far from normal 🏢
📉 Near-term GDP growth estimates are tracking negative. The Atlanta Fed’s GDPNow model sees real GDP growth declining at a 1.5% rate in Q1.

For more on the economy, read: 9 once-hot economic charts that cooled 📉
Earnings look bullish: The long-term outlook for the stock market remains favorable, bolstered by expectations for years of earnings growth. And earnings are the most important driver of stock prices.
Demand is positive: Demand for goods and services is positive, and the economy continues to grow. At the same time, economic growth has normalized from much hotter levels earlier in the cycle. The economy is less “coiled” these days as major tailwinds like excess job openings have faded.
But growth is cooling: To be clear: The economy remains very healthy, supported by strong consumer and business balance sheets. Job creation remains positive. And the Federal Reserve — having resolved the inflation crisis — has shifted its focus toward supporting the labor market.
Actions speak louder than words: We are in an odd period given that the hard economic data has decoupled from the soft sentiment-oriented data. Consumer and business sentiment has been relatively poor, even as tangible consumer and business activity continue to grow and trend at record levels. From an investor’s perspective, what matters is that the hard economic data continues to hold up.
Stocks look better than the economy: Analysts expect the U.S. stock market could outperform the U.S. economy, thanks largely due to positive operating leverage. Since the pandemic, companies have adjusted their cost structures aggressively. This has come with strategic layoffs and investment in new equipment, including hardware powered by AI. These moves are resulting in positive operating leverage, which means a modest amount of sales growth — in the cooling economy — is translating to robust earnings growth.
Mind the ever-present risks: Of course, this does not mean we should get complacent. There will always be risks to worry about — such as U.S. political uncertainty, geopolitical turmoil, energy price volatility, cyber attacks, etc. There are also the dreaded unknowns. Any of these risks can flare up and spark short-term volatility in the markets.
Investing is never a smooth ride: There’s also the harsh reality that economic recessions and bear markets are developments that all long-term investors should expect to experience as they build wealth in the markets. Always keep your stock market seat belts fastened.
Think long term: For now, there’s no reason to believe there’ll be a challenge that the economy and the markets won’t be able to overcome over time. The long game remains undefeated, and it’s a streak long-term investors can expect to continue.
For more on how the macro story is evolving, check out the previous review of the macro crosscurrents »
Here’s a roundup of some of TKer’s most talked-about paid and free newsletters about the stock market. All of the headlines are hyperlinked to the archived pieces.
The stock market can be an intimidating place: It’s real money on the line, there’s an overwhelming amount of information, and people have lost fortunes in it very quickly. But it’s also a place where thoughtful investors have long accumulated a lot of wealth. The primary difference between those two outlooks is related to misconceptions about the stock market that can lead people to make poor investment decisions.
Passive investing is a concept usually associated with buying and holding a fund that tracks an index. And no passive investment strategy has attracted as much attention as buying an S&P 500 index fund. However, the S&P 500 — an index of 500 of the largest U.S. companies — is anything but a static set of 500 stocks.

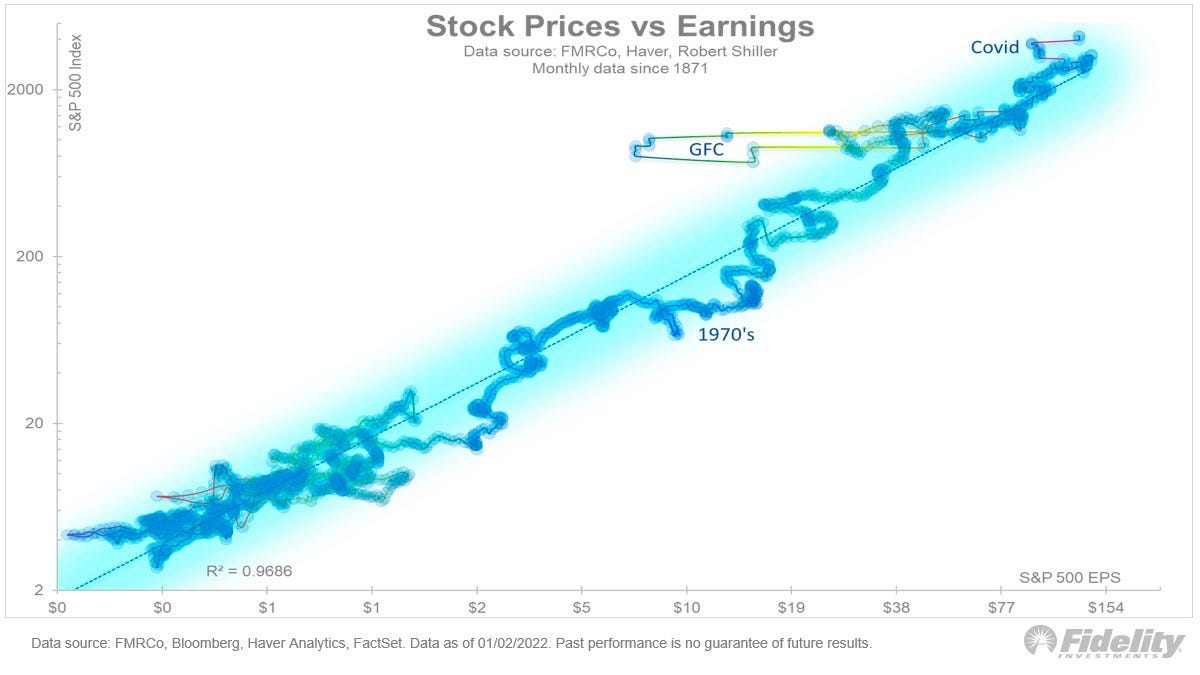
For investors, anything you can ever learn about a company matters only if it also tells you something about earnings. That’s because long-term moves in a stock can ultimately be explained by the underlying company’s earnings, expectations for earnings, and uncertainty about those expectations for earnings. Over time, the relationship between stock prices and earnings have a very tight statistical relationship.
Investors should always be mentally prepared for some big sell-offs in the stock market. It’s part of the deal when you invest in an asset class that is sensitive to the constant flow of good and bad news. Since 1950, the S&P 500 has seen an average annual max drawdown (i.e., the biggest intra-year sell-off) of 14%.
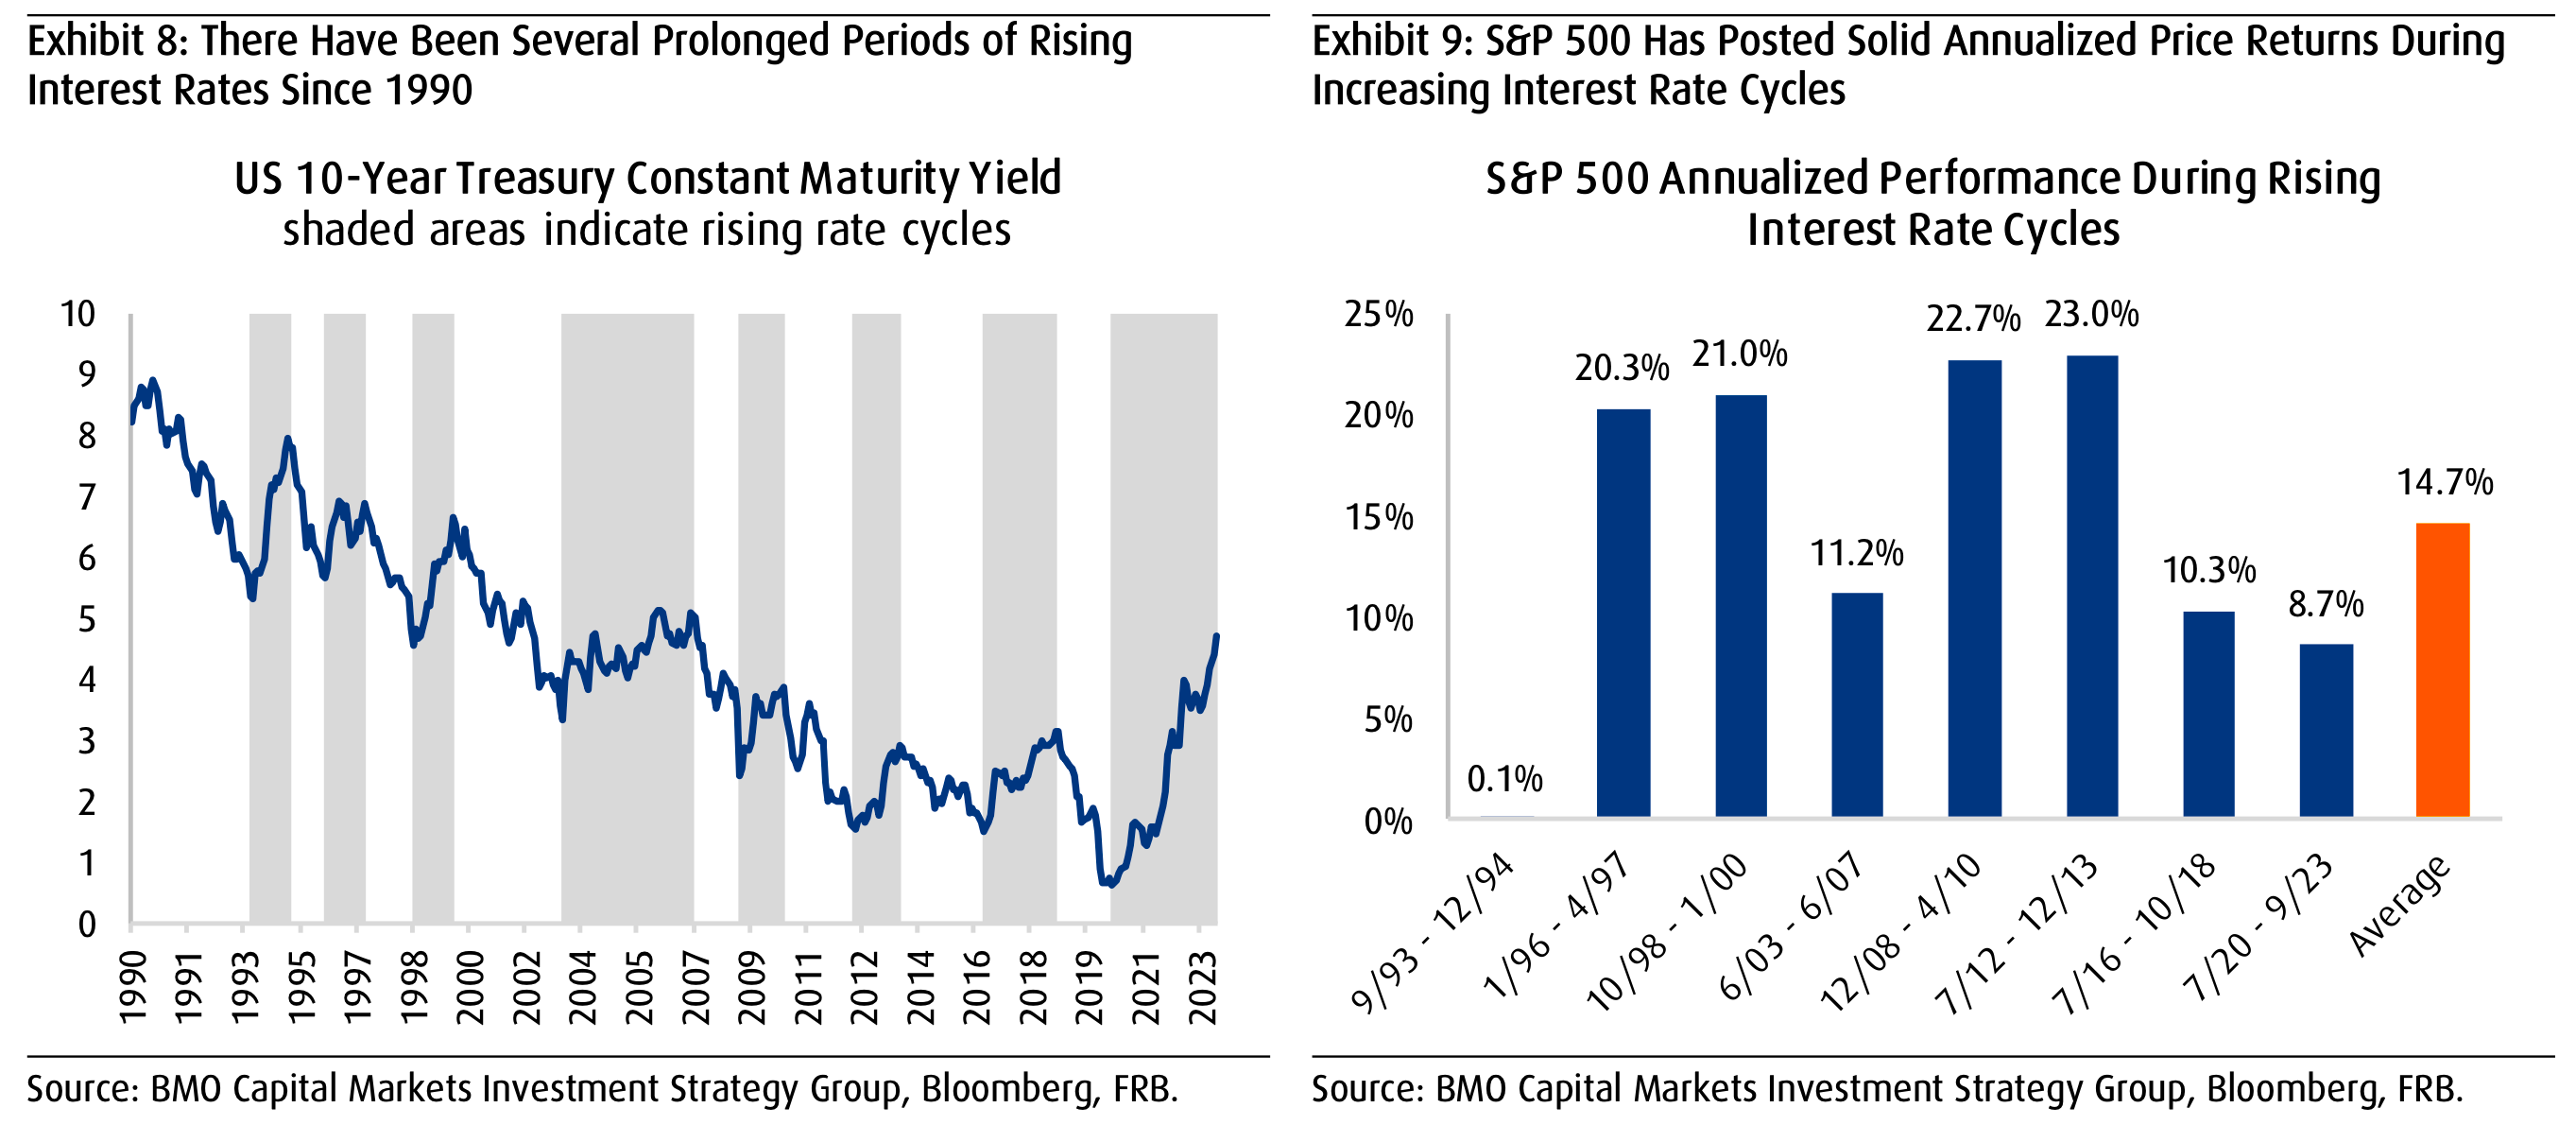
Generally speaking, rising interest rates are not welcome news for the economy and the stock market. They represent higher financing costs for businesses and consumers. All other things being equal, rising rates represent a hindrance to growth. However, the world is complicated, and this narrative comes with a lot of nuance. One big counterintuitive piece to this narrative is that historically, stocks have actually performed well during periods of rising interest rates.
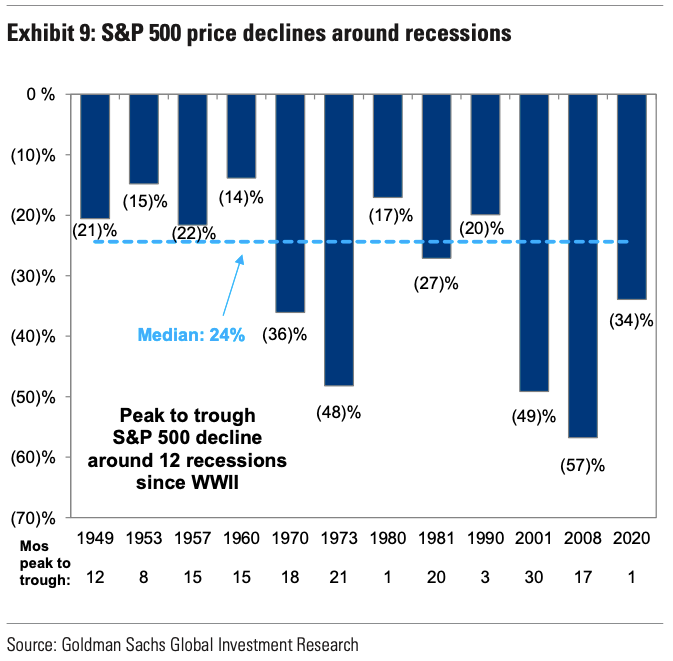
Every recession in history was different. And the range of stock performance around them varied greatly. There are two things worth noting. First, recessions have always been accompanied by a significant drawdown in stock prices. Second, the stock market bottomed and inflected upward long before recessions ended.
Since 1928, the S&P 500 generated a positive total return more than 89% of the time over all five-year periods. Those are pretty good odds. When you extend the timeframe to 20 years, you’ll see that there’s never been a period where the S&P 500 didn’t generate a positive return.
While a strong dollar may be great news for Americans vacationing abroad and U.S. businesses importing goods from overseas, it’s a headwind for multinational U.S.-based corporations doing business in non-U.S. markets.
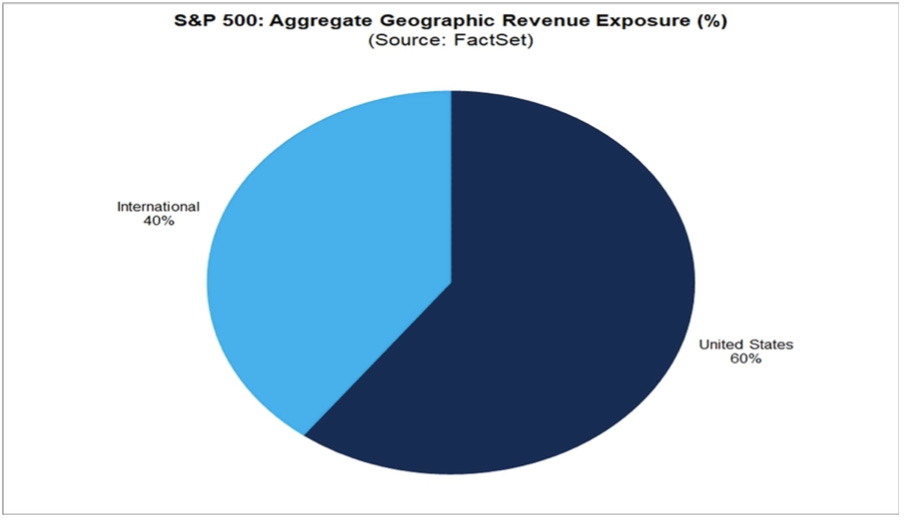
The stock market sorta reflects the economy. But also, not really. The S&P 500 is more about the manufacture and sale of goods. U.S. GDP is more about providing services.

…you don’t want to buy them when earnings are great, because what are they doing when their earnings are great? They go out and expand capacity. Three or four years later, there’s overcapacity and they’re losing money. What about when they’re losing money? Well, then they’ve stopped building capacity. So three or four years later, capacity will have shrunk and their profit margins will be way up. So, you always have to sort of imagine the world the way it’s going to be in 18 to 24 months as opposed to now. If you buy it now, you’re buying into every single fad every single moment. Whereas if you envision the future, you’re trying to imagine how that might be reflected differently in security prices.
Some event will come out of left field, and the market will go down, or the market will go up. Volatility will occur. Markets will continue to have these ups and downs. … Basic corporate profits have grown about 8% a year historically. So, corporate profits double about every nine years. The stock market ought to double about every nine years… The next 500 points, the next 600 points — I don’t know which way they’ll go… They’ll double again in eight or nine years after that. Because profits go up 8% a year, and stocks will follow. That’s all there is to it.
Long ago, Sir Isaac Newton gave us three laws of motion, which were the work of genius. But Sir Isaac’s talents didn’t extend to investing: He lost a bundle in the South Sea Bubble, explaining later, “I can calculate the movement of the stars, but not the madness of men.” If he had not been traumatized by this loss, Sir Isaac might well have gone on to discover the Fourth Law of Motion: For investors as a whole, returns decrease as motion increases.
According to S&P Dow Jones Indices (SPDJI), 59.7% of U.S. large-cap equity fund managers underperformed the S&P 500 in 2023. As you stretch the time horizon, the numbers get even more dismal. Over a three-year period, 79.8% underperformed. Over a 10-year period, 87.4% underperformed. And over a 20-year period, 93% underperformed. This 2023 performance follows 13 consecutive years in which the majority of fund managers in this category have lagged the index.

S&P Dow Jones Indices found that funds beat their benchmark in a given year are rarely able to continue outperforming in subsequent years. For example, 334 large-cap equity funds were in the top half of performance in 2021. Of those funds, 58.7% came in the top half again in 2022. But just 6.9% were able to extend that streak through 2023. If you set the bar even higher and consider those in the top quartile of performance, just 20.1% of 164 large-cap funds remained in the top quartile in 2022. No large-cap funds were able to stay in the top quartile for the three consecutive years ending in 2023.

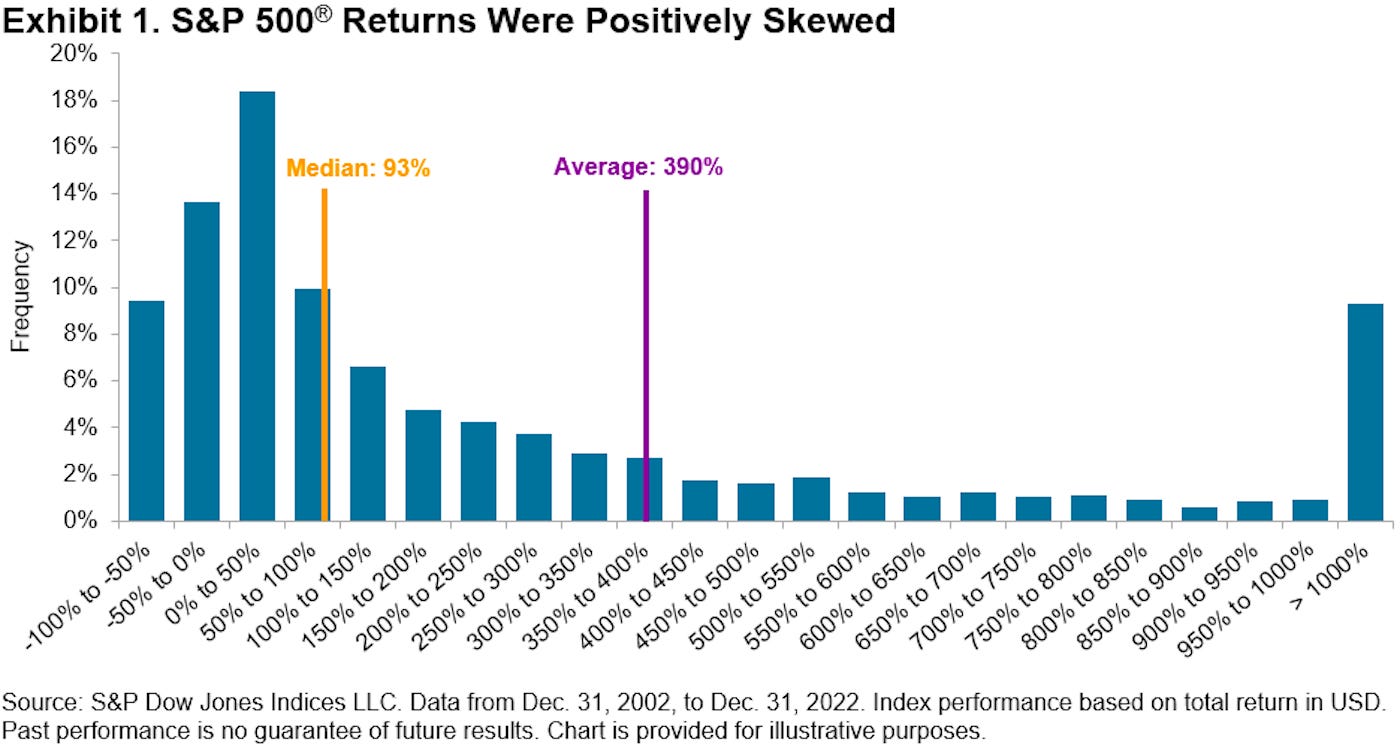
Picking stocks in an attempt to beat market averages is an incredibly challenging and sometimes money-losing effort. In fact, most professional stock pickers aren’t able to do this on a consistent basis. One of the reasons for this is that most stocks don’t deliver above-average returns. According to S&P Dow Jones Indices, only 24% of the stocks in the S&P 500 outperformed the average stock’s return from 2000 to 2022. Over this period, the average return on an S&P 500 stock was 390%, while the median stock rose by just 93%.


![i’m-nervous,-too!-[part-2]](https://10xwealthreport.com/wp-content/uploads/2026/03/177042-im-nervous-too-part-2-1568x784.jpg)