
- US Stock Benchmarks are trading in confusion ahead of large weekend risk
- Crude Oil remains stuck close to $100, not helping US equities as Traders prepare for significant US-Iran talks
- Exploring Technical Levels for the Dow Jones, Nasdaq and S&P 500
The Ceasefire still stands, but Markets are seeking further confirmation as US-Iran talks are set to proceed this weekend.
A significant barrier to the negotiations had been the ongoing Israeli attacks against Hezbollah in Lebanon, with the Islamic regime trying to hold onto its remaining strongholds in the Crescent.
Israel-Lebanon direct talks will begin on Tuesday, and strikes have been limited in the past 24 hours after a heated exchange between Trump and Netanyahu. Hezbollah continued waves of rocket and drone attacks since.
Still applying heavy leverage on the Strait of Hormuz ahead of the talks, only 4 tankers have crossed today, showing only minimal progress despite the ongoing truce.
While Iran has been pushing back on the discussions, creating internal tensions over who will be appointed to the Islamabad (Pakistan) talks, recent headlines have confirmed that it will participate.
Good news? Surely. This is better than nothing, particularly with the US side seemingly ready to make concessions to end the War sooner rather than later (after ~6 weeks of war).
But looking at the Stock Market today, traders have already priced them in and will now expect to see decisive progress in the coming days.
As per usual, the main point will be to see what’s next for the Strait of Hormuz and more particularly, Crude Oil prices, still stuck around the $98 to $100 tight range.
Any prediction of what is going to happen is nothing short of a gamble – The Trump Administration is serious about the talks, with midterms approaching and this war not faring well with the American population.
Demands will be strict, and the Iranian delegation will be under pressure.
It would be unrealistic to see an actual deal at the end of the weekend, but Markets will be leaning of White House communications.
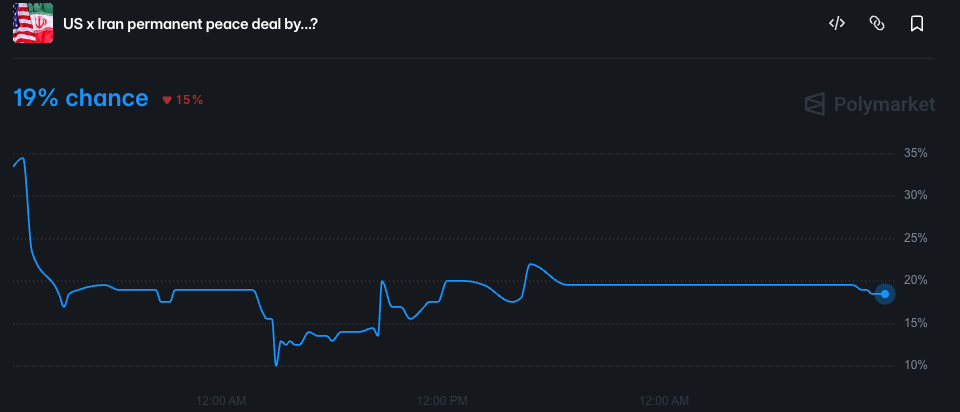
Odds for a proper peace deal before April 30 are still only priced below 20%. Traders will want to see a major gap down in Crude Oil prices to push stock prices higher.
Nasdaq was the only Index to rally today, but Sentiment is progressively souring as Participants are now increasingly taking profits on a very positive week, and all Benchmarks are now turning red.
As traders are getting ready for the final trading hours of the week, we will look at the short-term intraday charts and trading levels for the major US indexes: the Dow Jones Industrial Average, Nasdaq Composite, and S&P 500.
Current Session’s Stock Heatmap
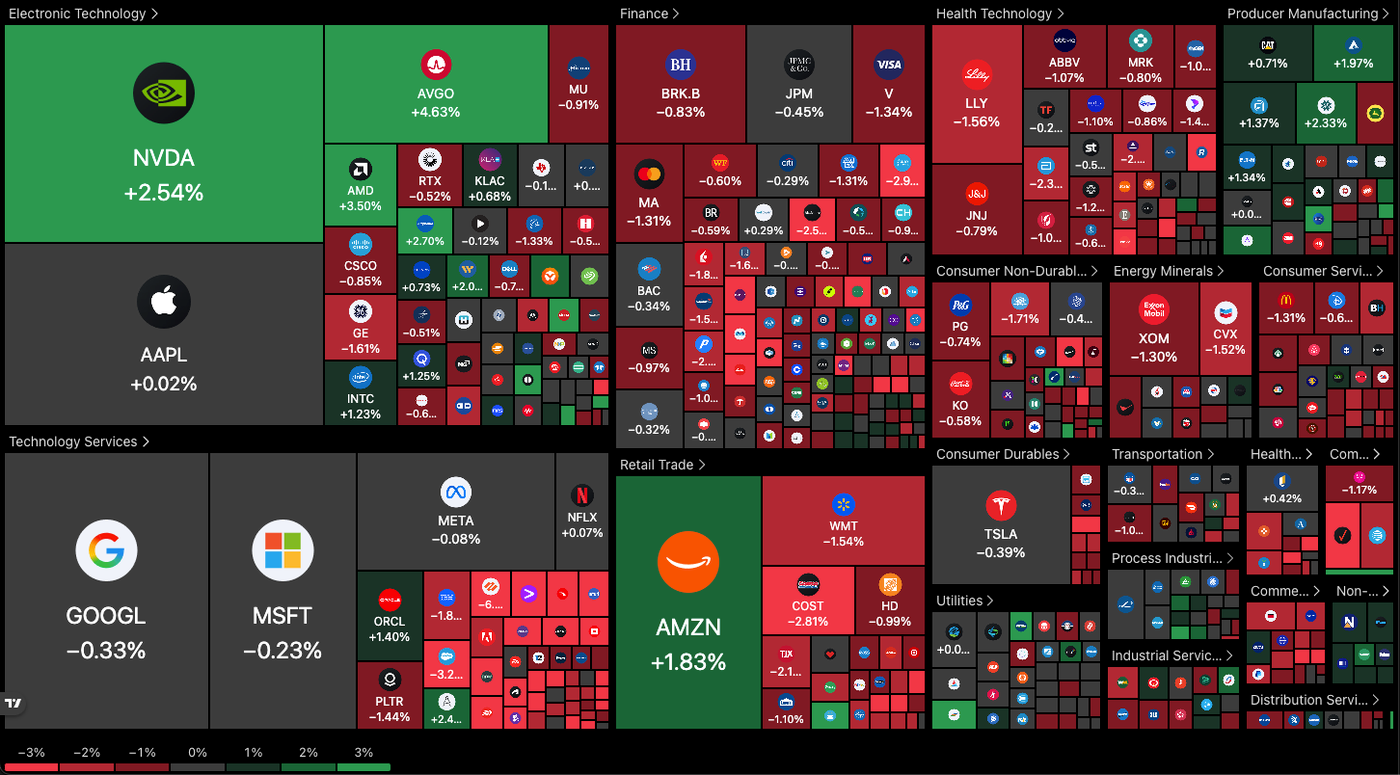
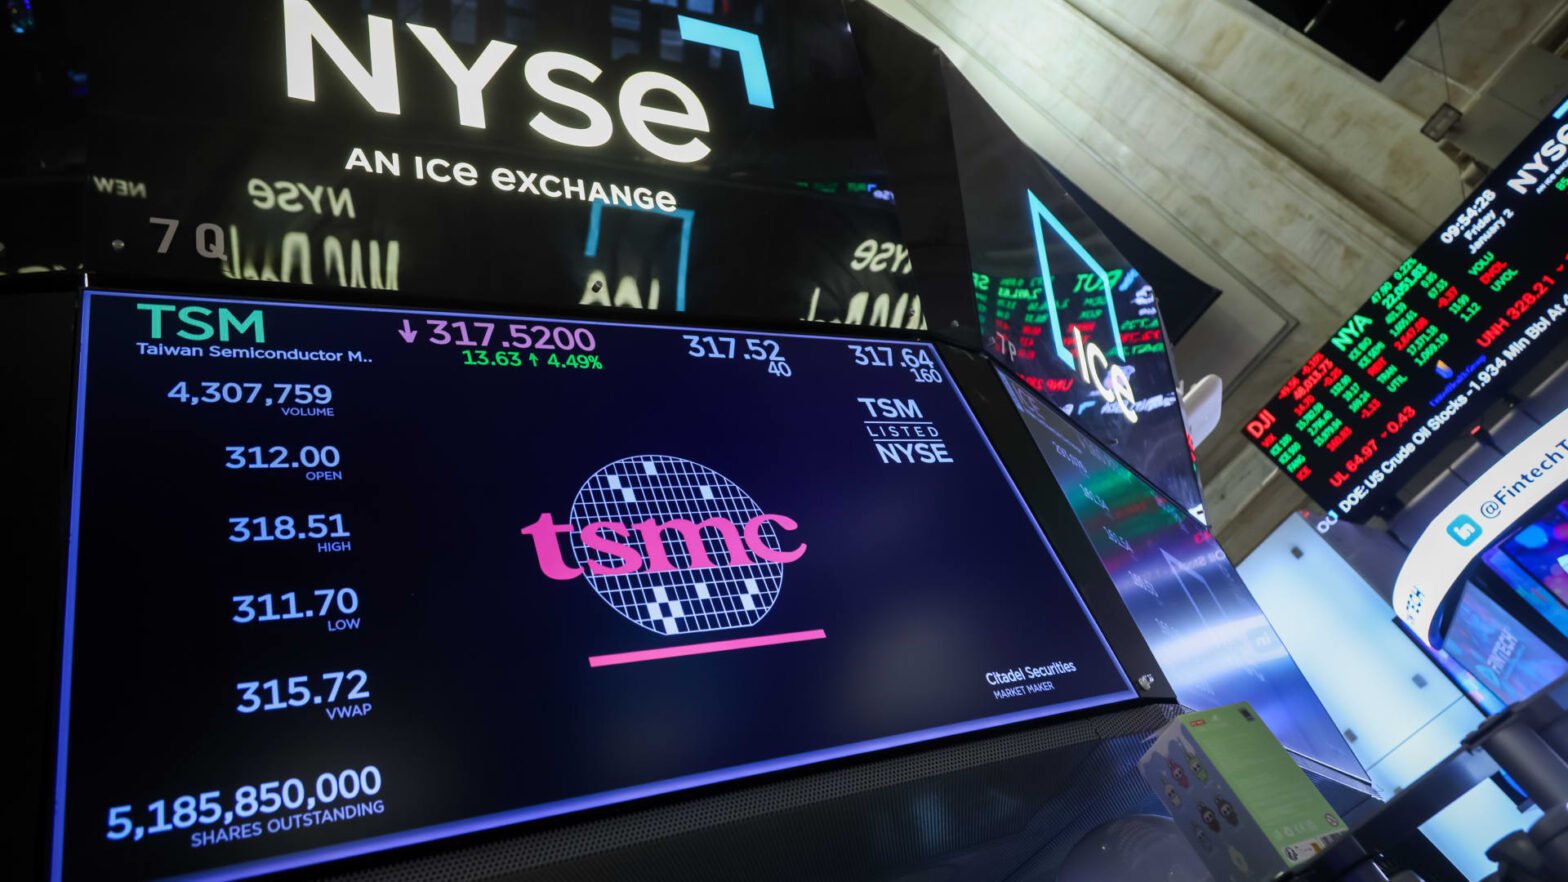
The profit-taking has been broad across the entire Stock Market, with participants easing their weekly purchases and rotating back into the names less affected by Wartime flows (including Semiconductors in Nvidia, AMD and AVGO).
Dow Jones 2H Chart and Trading Levels
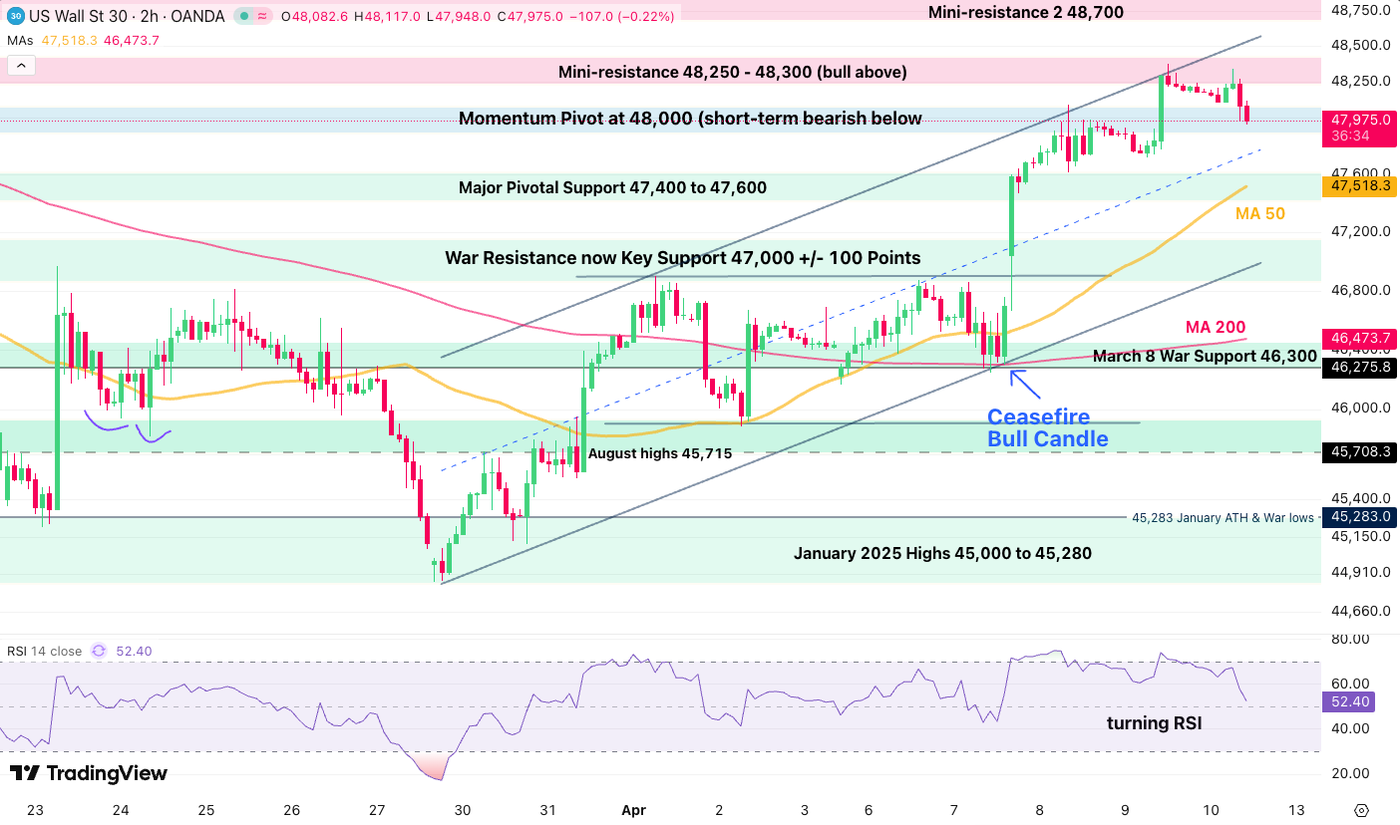
Dow Jones is now rejecting the higher bound of its upward channel and imminently breaking the key 48,000 level.
This could lead to profit-taking acceleration toward the afternoon but such trading levels have low odds of holding after the key week-end negotiation period.
- Good news would easily see a gap higher above 48,300
- A negative scenario would look to test 47,000
- Any break below puts wartime trading back into action
- Further uncertainty hints at progressive downside back to the 47,400 – 47,600 support
Dow Jones technical levels for trading:
Resistance Levels
- March 4 resistance 48,250 – 48,300 (bull above)
- Mini-resistance 48,700
- Major Resistance – 49,000 to 49,200
Support Levels
- Bull/Bear Momentum Pivot at 48,000 (+/- 100 points)
- Major Pivotal Support 47,400 to 47,600 (50-Hour MA)
- War Resistance now Key Support 47,000 +/- 100 Points (Bearish below)
- March 8 War lows Resistance now Support 46,300
- 45,700 to 45,900 August Support
- January 2025 Highs 45,000 to 45,280
Nasdaq 2H Chart and Trading Levels
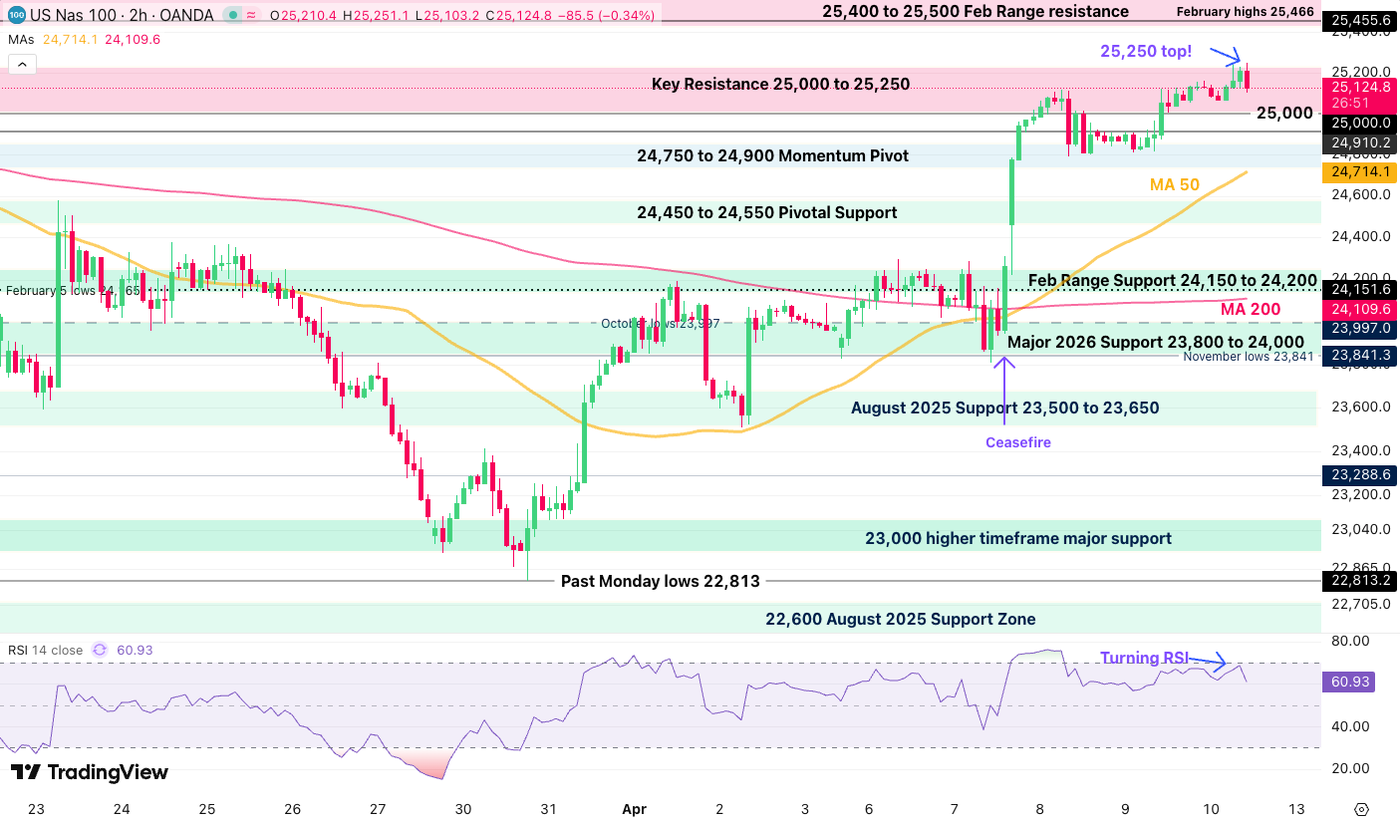
Nasdaq has just reached the top of its 25,250 resistance zone and momentum is now largely cooling, pointing to some downside ahead.
With the weekend action still uncertain, the end-afternoon session should still see continued profit taking back towards the 24,900 Intraday Momentum Zone.
Breaching it on Monday could see a quick test of 24,500 and below if the tone sours.
Nasdaq technical levels of interest:
Resistance Levels
- Key Resistance 25,000 to 25,250 (top at 25,250!)
- 25,400 to 25,500 Feb Range resistance
- Major resistance 25,700 to 25,850
Support Levels
- 24,750 to 24,900 Momentum Pivot
- 24,450 to 24,550 Pivotal Support
- Feb Range Support 24,150 to 24,200
- Major 2026 Pivotal Support 23,800 to 24,000
- August 2025 Support 23,500 to 23,650
- Early 2025 ATH at 22,000 to 22,229 Support
S&P 500 2H Chart and Trading Levels
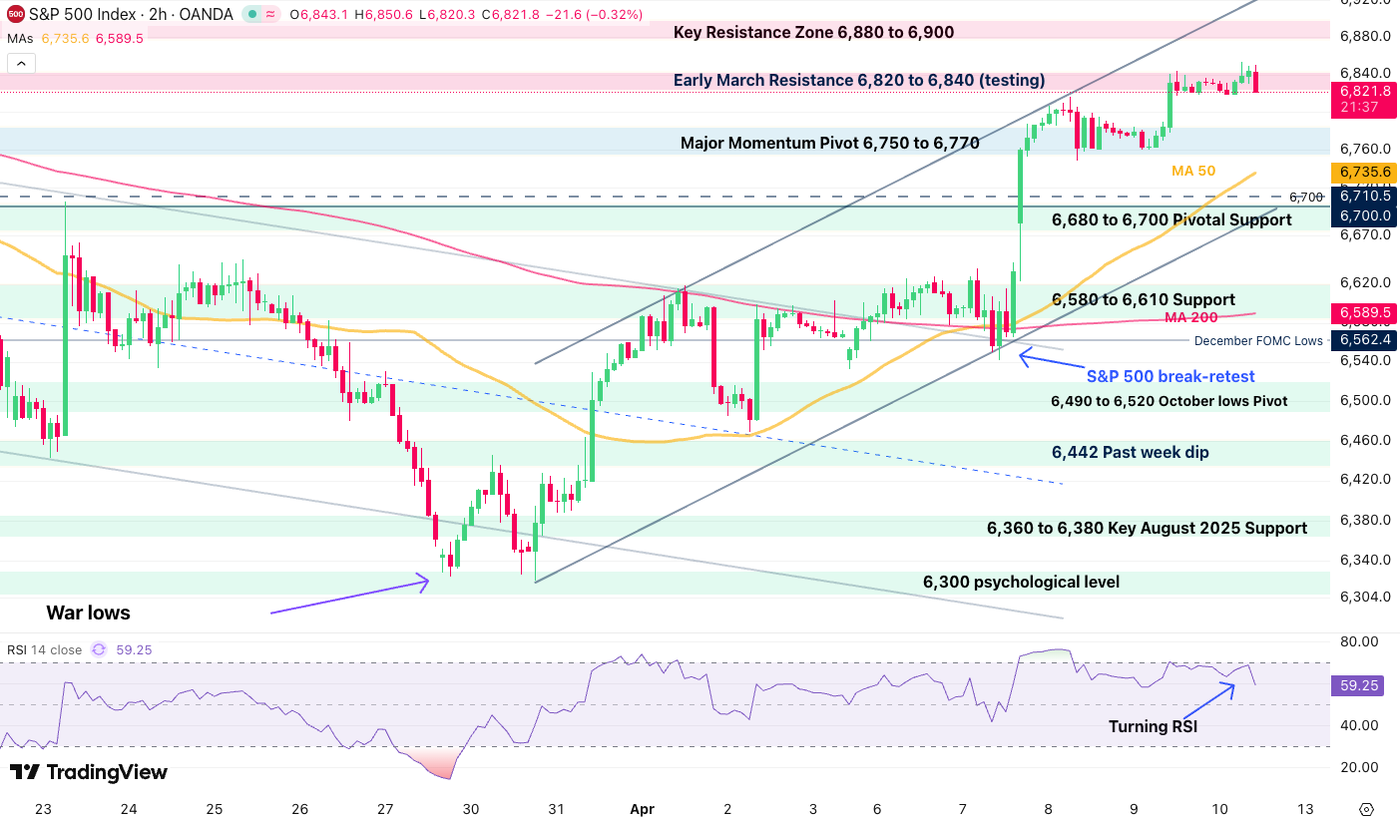
The S&P 500 is forming a similar turn in RSI momentum as Nasdaq, hinting at some downside towards the afternoon.
The action may stall at the 6,760 to 6,780 Pivot Zone in the waiting for further clarity.
- Downside continuation will point to 6,700.
- Good news should break 6,840 and may even extend to 6,900.
S&P 500 technical levels of interest:
Resistance Levels
- Early March Resistance 6,820 to 6,840 (rejecting)
- Key Resistance Zone 6,880 to 6,900
- Previous ATH Resistance 6,945 to 6,975
Support Levels
- Major Momentum Pivot 6,750 to 6,770
- 6,680 to 6,700 Pivotal Support (4H 200-period MA)
- 6,580 to 6,610 Support
- 4H 50-period MA 6,550
- 6,490 to 6,520 October lows
- 6,300 psychological level (War lows)
The narrative is easing, but keep track of WTI Crude and the latest headlines throughout the weekend to stay ahead of the game.
Safe Trades!
Follow Elior on Twitter/X for Additional Market News, interactions and Insights @EliorManier
Opinions are the authors’; not necessarily that of OANDA Business Information & Services, Inc. or any of its affiliates, subsidiaries, officers or directors. The provided publication is for informational and educational purposes only.
If you would like to reproduce or redistribute any of the content found on MarketPulse, an award winning forex, commodities and global indices analysis and news site service produced by OANDA Business Information & Services, Inc., please refer to the MarketPulse Terms of Use.
Visit https://www.marketpulse.com/ to find out more about the beat of the global markets.
© 2026 OANDA Business Information & Services Inc.
About the Author

Elior Manier
Market Analyst
Elior brings over seven years of experience in financial markets to our analyst team. Since 2018, he has actively engaged in observing, charting, and trading, driven by his passion for mastering market dynamics. With a profound understanding of the geopolitical and macroeconomic forces that shape market movements, Elior focuses on analysing the impact of breaking news, market sentiment, and critical economic data releases on trading flows.
As a versatile analyst, he contributes powerful insights to the team, effectively integrating geopolitical and technical analysis to provide clear and comprehensive market perspectives.
Prior to joining our team, Elior honed his expertise as a Fixed Income Trader and Market Analyst at the Montreal Exchange.