Mario Tama/Getty Images
- Three stock indicators suggest the S&P 500 has more room to fall, Ned Davis Research says.
- The firm pointed to a cluster of trends in the index that are moving closer to bearish territory.
- One indicator, the S&P 500’s reversal from recent highs, is already flashing a sell signal.
A cluster of indicators in the S&P 500 are sending a warning to investors: the pain from the Iran war may not be over.
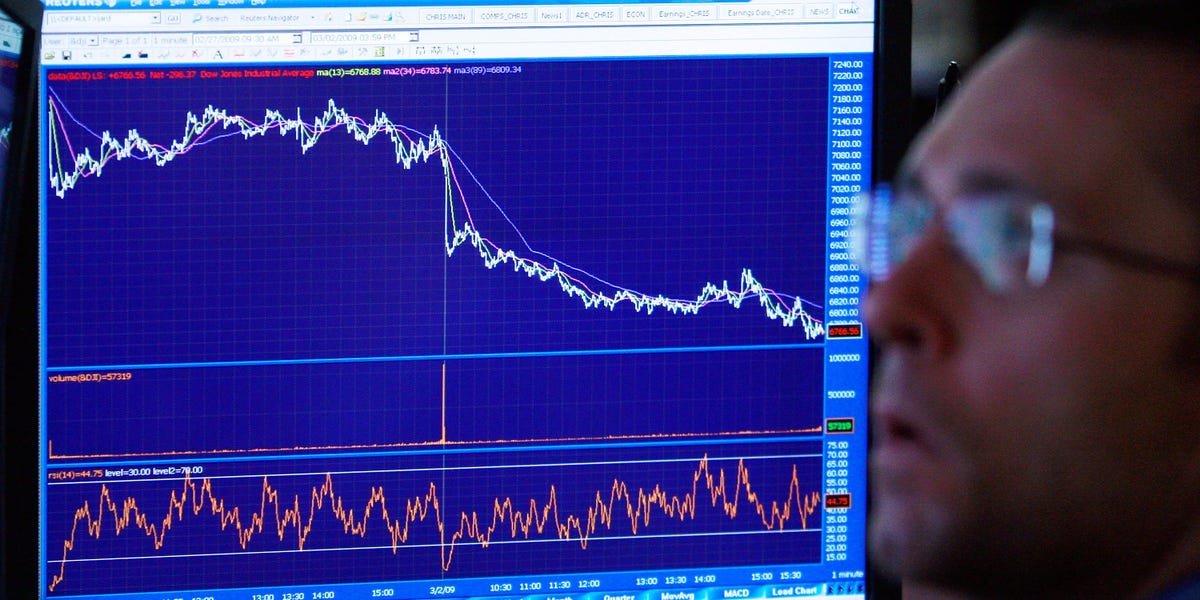
That’s according to Ned Davis Research, which says it sees a handful of trend indicators in the benchmark index that are close to, or already flashing, a sell signal. That could suggest more losses are coming for the S&P 500 — even considering how far the index has already fallen amid since the start of the Iran war.
The S&P 500 is trading 8% lower since the US and Israel first struck Iran in late February.
“Overall, the trend evidence is looking more ominous. Most of our major models have turned bearish,” London Stockton, a research analyst at NDR, wrote in a note to clients on Monday.
Stockton pointed to three signs in particular that suggested more downside for the market. Here are the bearish signals the firm is eyeing:
1. The S&P 500’s reversal from recent highs
The S&P 500 ended last week down 9% from its recent peak.
When the index drops at least 7.2% from its high as of the prior week, that’s historically been a sell signal for investors, the firm said, citing its analysis of the index’s percentage drawdowns over the last 79 years.
The sell signal suggests that investors should shift from stocks in the benchmark index into commercial paper, the firm added, referring to short-term corporate bonds.
“It too is susceptible to whipsaws but has been a great stop-loss when the market has further to fall,” Stockton said of the indicator.
2. The S&P 500 is moving closer to a ‘death cross’
A death cross is a bearish technical signal that flashes in the S&P 500 when the index’s 50-day moving average crosses below its 200-day moving average.
The S&P 500 hasn’t crossed that threshold yet. But the index’s 50-day moving average, which clocked in at around 6,803 on Monday, is moving closer to the 200-day, which stood at around 6,636.
“The chances of that happening soon barring a sudden and rapid recovery are increasing,” Stockton said of a death cross signal, though he noted that stocks tend to whipsaw and quickly recover once the signal flashes.
“But we include this indicator because it gives a longer-term warning and works well for larger and longer bear markets, such as in 2009 and 2022. A death cross would argue even more caution on stocks,” he added.
3. Volume demand and supply trends are leaning bearish
The volume demand in the S&P 500 is declining while volume supply is rising, a sign that investors are becoming more interested in selling the index than buying it.
The spread between volume demand and supply came in at around 1.25 on Friday, according to the firm’s analysis. If the spread were to fall below 0.8, that suggests investors should sell stocks and purchase Treasury bonds, the note said.
“It is just shy of giving a sell signal,” Stockton said of the indicator.


![i’m-nervous,-too!-[part-2]](https://10xwealthreport.com/wp-content/uploads/2026/03/177042-im-nervous-too-part-2-1568x784.jpg)