Latest Updates
Stocks were mostly higher after a closely watched gauge of U.S. manufacturing indicated that activity continued to shrink, but at a slower pace in November.
The Institute for Supply Management’s manufacturing index rose to 48.4% last month from 46.5% in October and exceeded Wall Street’s forecast for a reading of 47.5%. A reading of less than 50% indicates contraction, while a figure above that threshold indicates expansion. The index has hovered below the key 50% cutoff mark in every month but one for the past two years.
The Dow fell 185 points, or 0.4%, while the S&P 500 was holding a gain of 0.2% and the tech-heavy Nasdaq Composite rose 0.9%. The Dow and S&P 500 ended Friday at records as major indexes posted their best month of 2024.

Stocks are at historically lofty valuations and near record lows for riskier high-yield bonds (FactSet, through Nov. 30 2024)
Investors can’t seem to get enough of U.S. stocks or riskier bonds in the final stretch of the year. But can the rally last?
“We just witnessed one of the best two-year returns for the S&P 500 in history,” Emily Roland and Matt Miskin, John Hancock Investment Management’s co-chief investment strategists, wrote in a Monday client note.
“On the fixed income side, high yield bond valuations are similarly rich with U.S. high bond spreads near their lowest levels in history,” they said.
To help offset “valuation risk” in 2025, the team suggested that investors consider a mid-cap equities bias and “core-plus” type exposure in higher quality bonds with a roughly 5% return target.
Disrupted supply chains caused by geopolitical risks, distorted inflation reads, and greater volatility are among the factors that set the dollar up for a bullish run early next year, according to TD strategist Mark McCormick.
“A critical feature of the current backdrop is one of political economy and geopolitics (geomacro),” he wrote in an email on Monday.
“Technology is also guiding these trends, which is exacerbating wealth distribution and income inequality. Governments can’t keep up, thus increasing voter dissatisfaction and shortening half-lives of political power. The pandemic and geopolitics disrupted supply chains, distorting the read of inflation. In the end, we expect more volatility and uncertainty as a first order effect.”
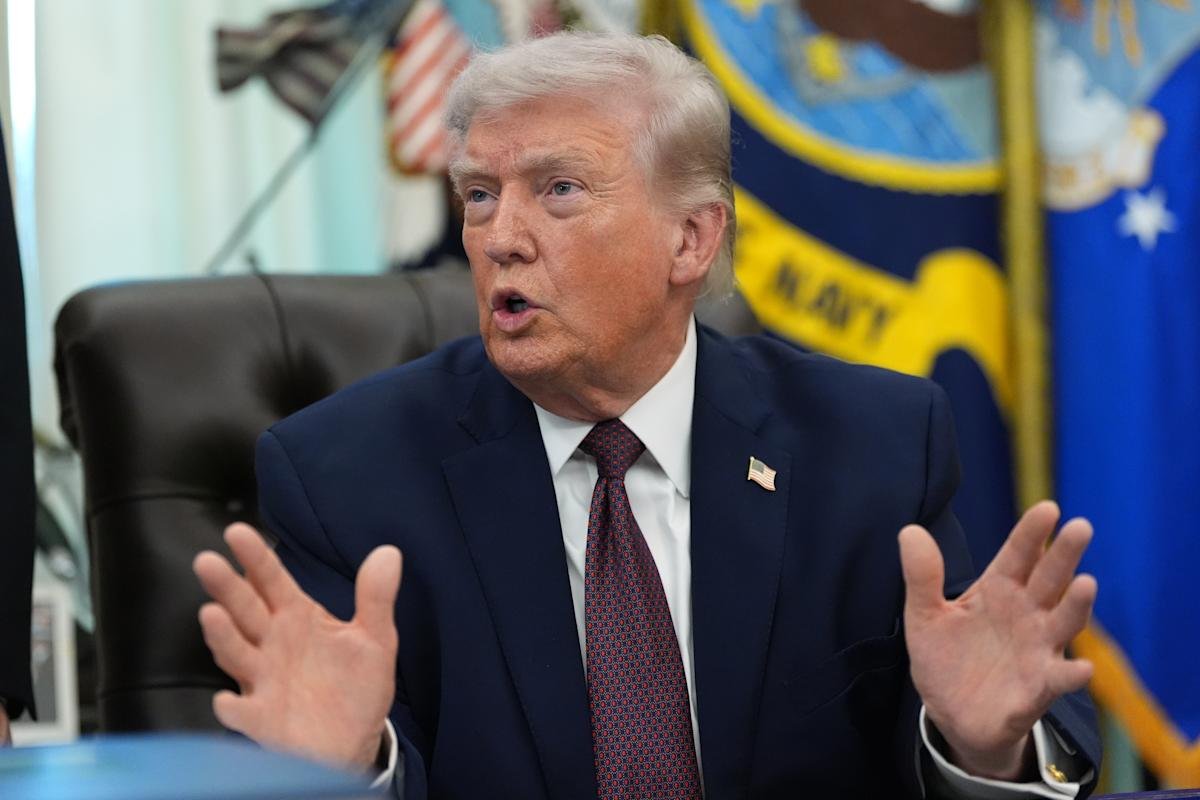
As of Monday morning, the ICE U.S. Dollar Index was up 0.7% at around 106.47 after President-elect Donald Trump’s weekend tariff threat against the BRIC alliance, or bloc of nine nations.
The U.S. stock market kicked off December with modest gains, as the Dow Jones Industrial Average and S&P 500 built on record finishes ahead of a busy week of economic data.
“There is a risk in the week ahead for Goldilock’s economics – where FOMC rate cuts are dependent on the data ahead in being just right and in the role of the FOMC to confirm such. The key will be the US labor market data from JOLTs to US non-farm payrolls,” said Bob Savage, head of markets strategy and insights at BNY, in a note.
U.S. yields jumped from their lowest levels since October Monday morning after President-elect Donald Trump threatened 100% tariffs against the so-called BRIC alliance if they take actions to undermine the dollar.
Trump’s threat over the weekend against the bloc of nine nations — Brazil, Russia, India, China, South Africa, Egypt, Ethiopia, Iran and the United Arab Emirates — triggered a selloff in U.S. government debt.
The policy-sensitive 2-year yield jumped 4.7 basis points to 4.218%, while the benchmark 10-year yield rose 2.8 basis points to 4.22%. On Friday, they finished at their lowest levels since Oct. 31 and Oct. 21, respectively.
It’s a big week for economic data, including Friday’s November jobs report. Another round of “Goldilocks” — neither too hot nor too cold — figures could help set the stage for a rally to year-end, wrote Tom Essaye, founder of Sevens Report Research, in a Monday note.
“From a positioning standpoint, if data is Goldilocks and the rally continues into year-end, we expect that rally to continue t broaden and include the “rest of the market” (cyclical and Trump-trade sectors such as industrials, financials, consumer discretionary, energy) over super-cap tech and defensive sectors (although utilities remain an outlier as they are insulated from any trade threats),” he wrote.
Futures are pointing toward a very slight pullback in the S&P 500 on Monday after the index clinched its strongest monthly performance in a year.
But as the index capped off November at a record high, beneath the surface, the percentage of S&P 500 stocks hitting fresh 12-week lows fell to zero.
The chart above comes courtesy of Naeem Aslam, CIO of Zaye Capital Markets.
That’s not super uncommon, as readers can see from the chart. Still, traders often interpret the momentum of individual stocks in the index as a barometer of the rally’s health. If the number of stocks hitting fresh lows was creeping higher, some would see it as a sign that a pullback might be in order.
Jay Woods of Freedom Capital Markets has crunched the data on what happens during December in years when markets rip.
The answer: they keep ripping. Specifically, since 1950, there have been nine occasions of 20%+ gains heading into the final two months.
During those Decembers, the average gain has been 3.16%, with gains in eight of the nine times.
“Seasonal statistics have been true to form for the past two years. That bodes well for December as it has been the second best month for the market,” he says.
“Add in the fact that in years where the market has had strong returns, many money managers have to chase performance so winners may continue to add to their gains. They also won’t have many losses they can use to sell to tax harvest. That helps set the table for the rally to continue.”
Gold and silver prices fell on Monday, pressured by a rising dollar and higher Treasury yields.
Gold for February delivery fell $14, or 0.5%, to $2,667.10 an ounce, while silver prices dropped 17 cents, or 0.5%, to $30.94 an ounce. Gold prices have climbed 28% this year, and some analysts have predicted the commodity could reach as high as $3,000 in 2025.
The ICE U.S. Dollar Index rose around 0.5% to 106.25, getting a boost in part after President-elect Donald Trump on Saturday warned he’d slap a 100% tariff rate on BRICS countries if they tried to replace the U.S. dollar.
“Traders are increasingly focused on the likelihood of the Federal Reserve maintaining higher interest rates for longer, a dynamic supporting the dollar and Treasury yields while weighing on the appeal of the nonyielding precious metal,” Ricardo Evangelista, senior ActivTrades analyst, told clients in a note.
“The prospect of the incoming Trump administration triggering a trade war that could reignite inflation, combined with the robust performance of the U.S. economy, further reinforces expectations that the central bank will slow the pace of rate cuts,” Evangelista said.
The yield on China’s 10-year government bond fell below 2%, the latest indicator of the country’s rocky economic performance. That’s the lowest level on record.
The 2% level has been viewed by some as a line in the sand. Bank of America strategist Michael Hartnett, for example, has identified that level as a key threshold as he advised investors last month to “sell hubris and buy humiliation,” the latter referring in part to Chinese assets.


![i’m-nervous,-too!-[part-2]](https://10xwealthreport.com/wp-content/uploads/2026/03/177042-im-nervous-too-part-2-1568x784.jpg)