

- US Stock Benchmarks are sending mixed signals despite positive CPI report
- Traders will await for further clues and news in order to move forward
- Exploring Technical Levels for the Dow Jones, Nasdaq and S&P 500
The tone in Financial Markets has now eased despite the ongoing US-Iran-Israel conflict, now in its 12th day – Stock Indexes are still failing to generate traction, currently victim of strengthening selling flows.
The almost-perfect inverse correlation between Stock Markets and oil prices has now stalled, with Crude volatility also coming to a brutal halt.
It is surprising to see Markets disregard the pretty positive CPI report (coming in at 2.4%, as expected), but this points to a new dynamic: Current progress in inflation won’t help if inflation expectations, rising from higher Oil prices, remain high.
This further emphasizes Surveys like the University of Michigan Consumer Sentiment (released Friday at 10:00 A.M.) and the NY Fed’s Inflation Expectation Survey.
Rate cut pricing will also be particularly tied to the Core PCE numbers (next release also on Friday, 8:30 A.M.), the Federal Reserve’s favorite inflation gauge.
As noted in our fresh Oil analysis, the commodity is pointing to a more rangebound price action ahead – but any significant breakout, even if it is slow and persistent, will dampen risk appetite until a clear resolution of the conflict.
Still, the past few sessions of rebounds have helped US benchmarks recover into their higher time-frame ranges – Keep a close eye on immediate action as sentiment takes a turn lower by the minute.
Keep in mind that an ongoing trend is developing around Financials, particularly Private Asset Managers, which are seeing waves of liquidations and a much tighter lending Market – This damaged risk-sentiment a few Fridays ago and could have a much wider impact if this spreads further.
Let’s spot where today’s hesitant price action is implying by diving into today’s mid-session charts and key trading levels for the major US indexes: the Dow Jones, Nasdaq, and S&P 500.
Current Session’s Stock Heatmap
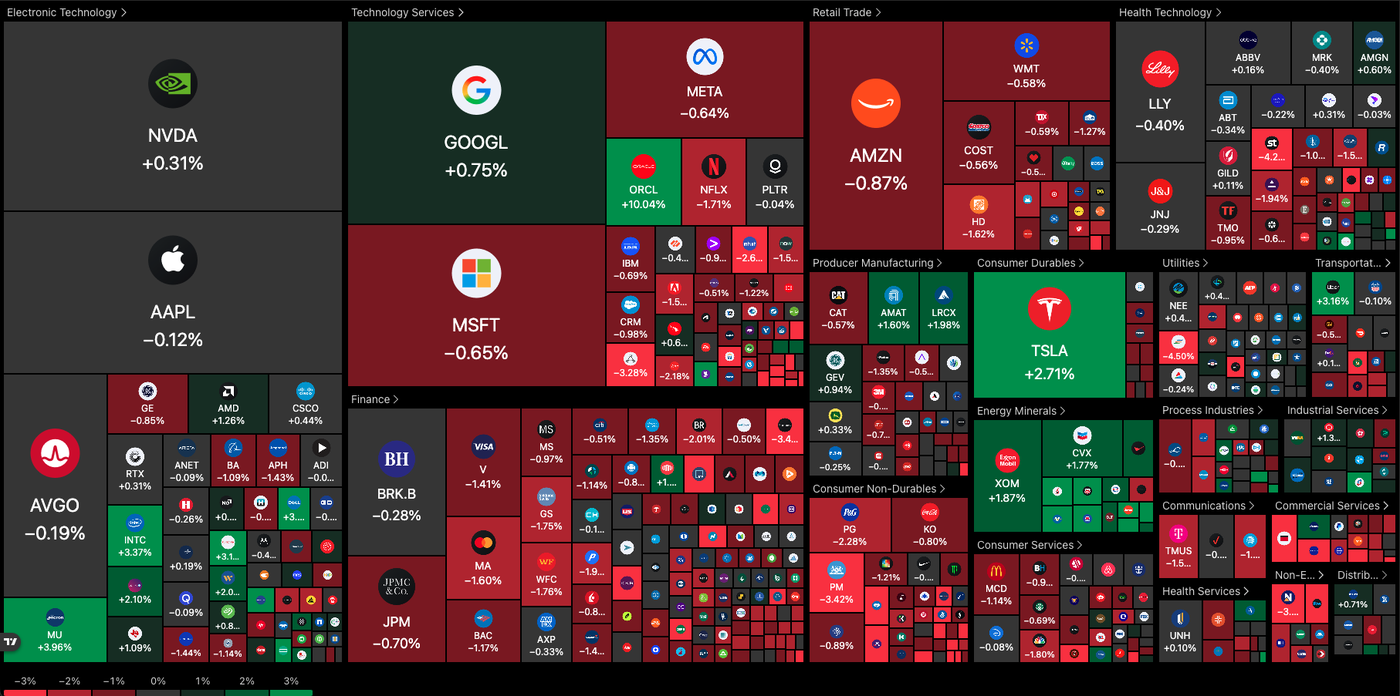
The current Market picture is quite mixed, with many sectors and key names unchanged while some others are bleeding, like Financials, Retail Trade and Consumer Non-Durables.
On the other hand, US Fertilizers, Consumer Durables, Energy stocks and Transportation are rebounding – The Green Sheep out of them all however really is Oracle, flying higher by 10% since its past day wonderful earnings report.
Dow Jones 1H Chart and Trading Levels
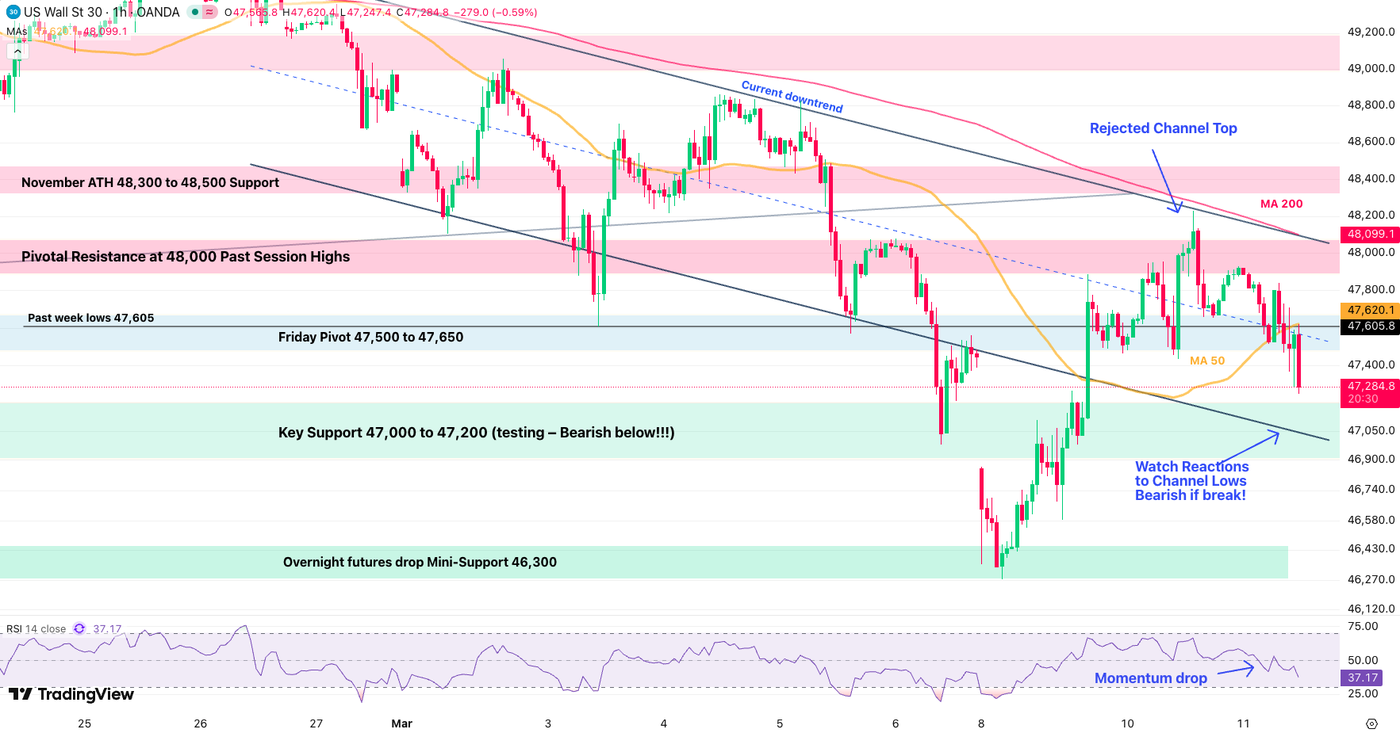
The Dow Jones is now struggling after rejecting the upper bound of its descending channel.
Reactions to its lower bound will be very key (see on chart) – As prices are reaching the Major 47,000 – 47,200 Support again, a failure to rebound from here would hurt bull prospects even further.
Expect a more bearish price action ahead in that event.
Dow Jones technical levels for trading:
Resistance Levels
- Friday Pivot 47,500 to 47,650 (50-Hour MA 47,619)
- Pivotal Resistance at 48,000 (Past day highs)
- 48,400 key level to break for continued rebound
- November ATH 48,300 to 48,500 Support and Channel highs
- Index All-Time highs 50,512
Support Levels
- Key Support 47,000 to 47,200
- Monday futures drop Mini-Support 46,300
- 46,000 +/- 100 pts November Support
- August highs 45,715
- 45,000 psychological level (Main Support on higher timeframe)
Nasdaq 1H Chart and Trading Levels
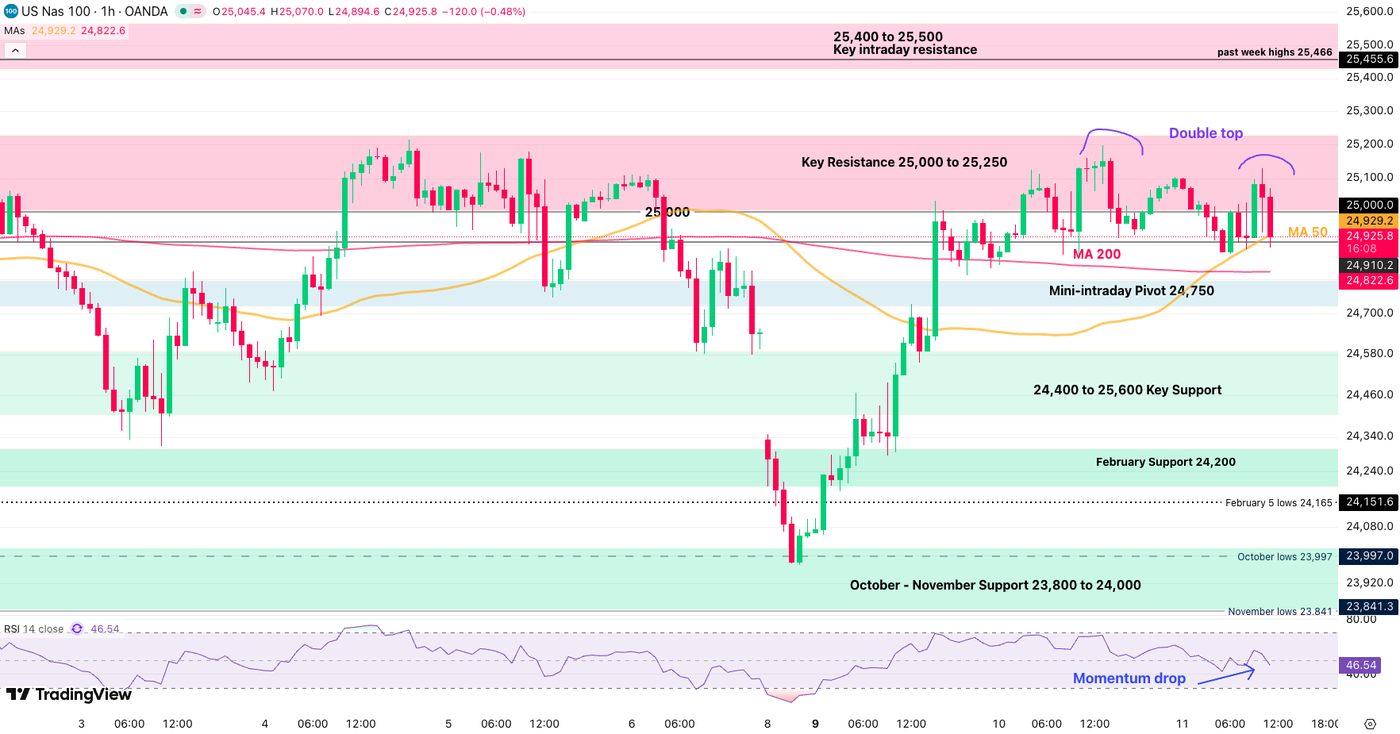
Nasdaq is now rejecting the 25,000 which provides some bearish signs for upcoming action.
Now crossing below the its 50-Hour MA (24,930), accompanied by an intraday double top, it would not be surprising to see a quick test of the 24,500 Support area.
Failing to rebound there would lead to the 24,000 Support.
Nasdaq technical levels of interest:
Resistance Levels
- 50-Hour MA 24,928
- Key Resistance 25,000 to 25,200 (mini range highs)
- 25,400 to 25,500 Key intraday resistance
- Pivotal resistance 25,700 to 25,850 (all-time highs if break)
Support Levels
- Mini-intraday Pivot 24,750
- 24,400 to 25,600 Key Support
- October and Overnight lows 23,972
- October – November Support 23,800 to 24,000 (Monday drop)
- Early 2025 ATH at 22,000 to 22,229 Support
S&P 500 1H Chart and Trading Levels
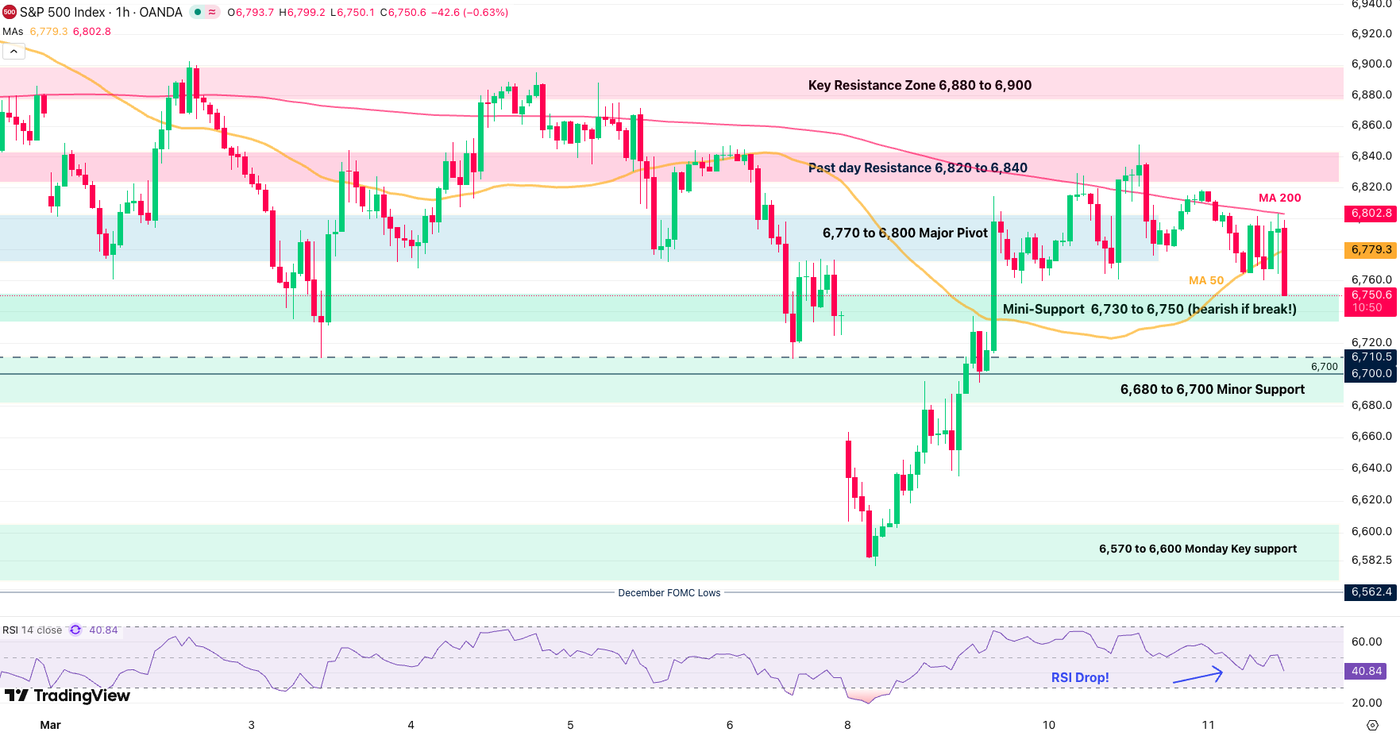
The S&P 500 is now turning bearish after yesterday’s top rejection, particularly with the latest hour of profit-taking – The RSI is now crossing below the neutral line.
Breaking the 6,730 should see continuation to the downside. If 6,700 breaks, expect to see a quick test of the Monday lows (6,579).
S&P 500 technical levels of interest:
Resistance Levels
- 6,770 to 6,800 Momentum Pivot
- Past Day Resistance 6,820 to 6,840 (2H 200-MA)
- Key Resistance Zone 6,880 to 6,900
- Previous ATH Resistance 6,945 to 6,975
Support Levels
- Mini-Support 6,730 to 6,750 (immediate test, bearish if break!)
- 6,680 to 6,700 Key Support
- Monday lows 6,579
- 6,490 to 6,512 October lows Immediate Support
- 6,400 Major psychological support
Safe Trades and keep a close eye on the US-Iran developments!
Follow Elior on Twitter/X for Additional Market News, interactions and Insights @EliorManier
Opinions are the authors’; not necessarily that of OANDA Business Information & Services, Inc. or any of its affiliates, subsidiaries, officers or directors. The provided publication is for informational and educational purposes only.
If you would like to reproduce or redistribute any of the content found on MarketPulse, an award winning forex, commodities and global indices analysis and news site service produced by OANDA Business Information & Services, Inc., please refer to the MarketPulse Terms of Use.
Visit https://www.marketpulse.com/ to find out more about the beat of the global markets.
© 2026 OANDA Business Information & Services Inc.
About the Author

Elior Manier
Market Analyst
Elior brings over seven years of experience in financial markets to our analyst team. Since 2018, he has actively engaged in observing, charting, and trading, driven by his passion for mastering market dynamics. With a profound understanding of the geopolitical and macroeconomic forces that shape market movements, Elior focuses on analysing the impact of breaking news, market sentiment, and critical economic data releases on trading flows.
As a versatile analyst, he contributes powerful insights to the team, effectively integrating geopolitical and technical analysis to provide clear and comprehensive market perspectives.
Prior to joining our team, Elior honed his expertise as a Fixed Income Trader and Market Analyst at the Montreal Exchange.