

- US Stock Benchmarks are now attempting a more significant bounce from recent lows as the War narrative eases
- Taking a step back to daily charts for Stock Indexes to determine if today’s rebound is a bull-trap or an actual opportunity
- Exploring Daily Charts for the Dow Jones, Nasdaq and S&P 500
When the Trump Administration pivots, it does in a flash.
And after the five weeks of War, the initial deadline is coming to its end – the US President implied that he would leave the defense of the Strait of Hormuz to European and Asian nations that have been reluctant to act in the region since the beginning of the month.
This would be yet another return to the infamous America First policy, this time leaving more dire consequences around the old Continents with Military operations now reaching their peaks, with Gulf countries and Europe having to deal with the post-conflict protection.
Despite this resolution potentially marking a more unstable future outlook, Markets are taking a breather from the persistent selloff seen throughout recent weeks.
Tumbling about 10% across all Benchmarks, US Indexes are reaching interesting technical levels – The idea is that with forward-looking Markets, and US interests (seemingly) protected, investors could slowly ease up on their bearish fears.
Crude prices remain dangerously high when assessing the dampening effect the 50% rise will have on the global economy which has been slowing its post-COVID ascent.
WTI is holding around $105 while Brent eased significantly to $107 – Check out our past day scenarios for Oil prices and key levels.
As long as energy commodities’ prices don’t correct, it will be difficult to remain so optimistic.
But at least, Investors can start to shun some of their uncertainty regarding escalations.
This entire narrative is certainly not over yet, and reactions could be larger on an official announcement – However, we might be nearing the conflict’s maximum point.
Today, we will take a step back to spot where recent Market corrections took US Benchmarks – Let’s examine the Daily charts and trading levels for the major US indexes: the Dow Jones, Nasdaq, and S&P 500 to spot if this is indeed a longer-run investment opportunity.
Current Session’s Stock Heatmap
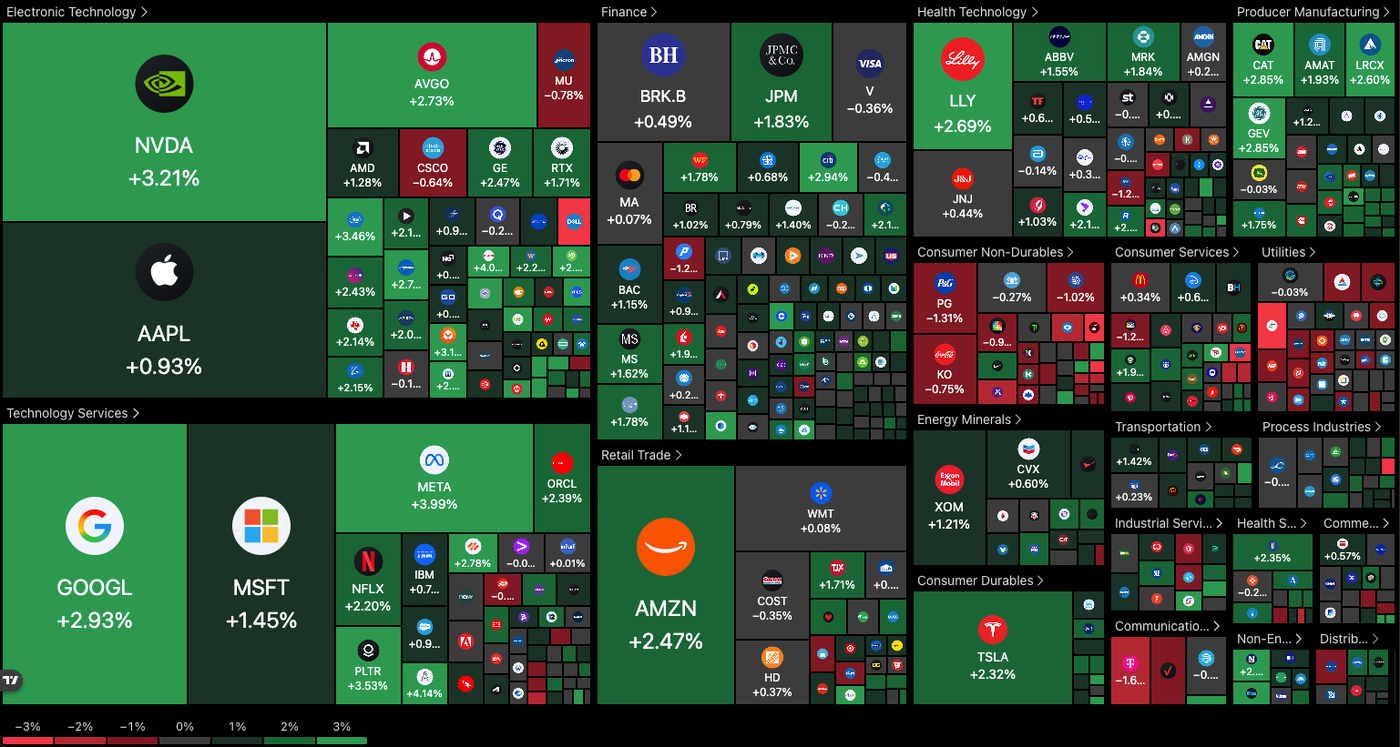
The rebound from the previous session continues and is now way more widespread, particularly in the key Tech and Manufacturing sectors.
Mega Caps are actually leading today’s rally with Nvidia up 3%, Google and Amazon following suit – Even in more defensive sectors like Healthcare and Finance, Market leaders (JP Morgan, Eli Lilly) are pulling the rest of the Market higher.
This marks a defensive optimism where investors are still looking for the most quality stocks in order to avoid a more brutal comedown in case the narrative sours.
Dow Jones Daily Chart and Trading Levels
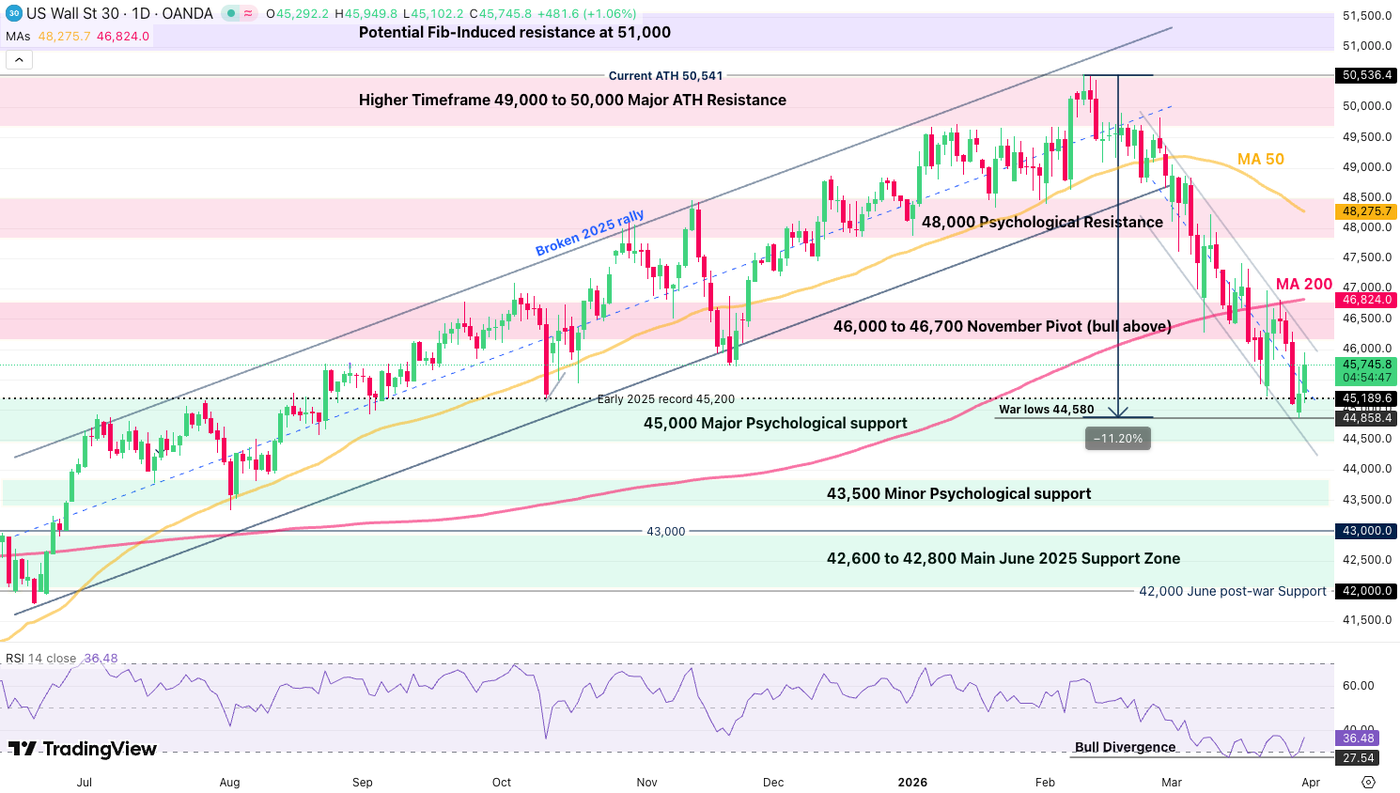
The Dow Jones is still evolving in its major pullback downtrend, reacting significantly to the 45,000 Major Support (Early 2025 record).
The price action remains bearish on the mid-term, but after an 11% correction, some small, progressive dip-buying at this key level could be justified for longer-run.
This technical setup is supported by the past session’s failed lows (new cycle trough but didn’t close below) and a large bullish divergence forming.
- One element to consider is whether bulls can manage a break out of the downward channel (daily close above 46,000)
- The Momentum will only be mid-term bullish above the 200-Day MA (46,820)
- The next stop will be the 50-Day MA, above this, expect Markets to regain an easy path to all time highs
To check out intraday technical levels, check out our past day analysis!
Dow Jones Daily technical levels for trading:
Daily Resistance Levels
- 46,000 to 46,700 November Pivot (bull above)
- 46,820 200-Day MA
- Intraday Momentum Resistance 47,500 to 47,650
- Key Resistance and 50-Day MA at 48,000
Daily Support Levels
- January 2025 Highs and War Lows 45,280
- Channel and Morning lows 44,840
- Next Minor Support 44,200 to 44,500
- Major Support 43,500 to 43,750
- 36,600 Liberation Day Lows
Nasdaq Daily Chart and Trading Levels
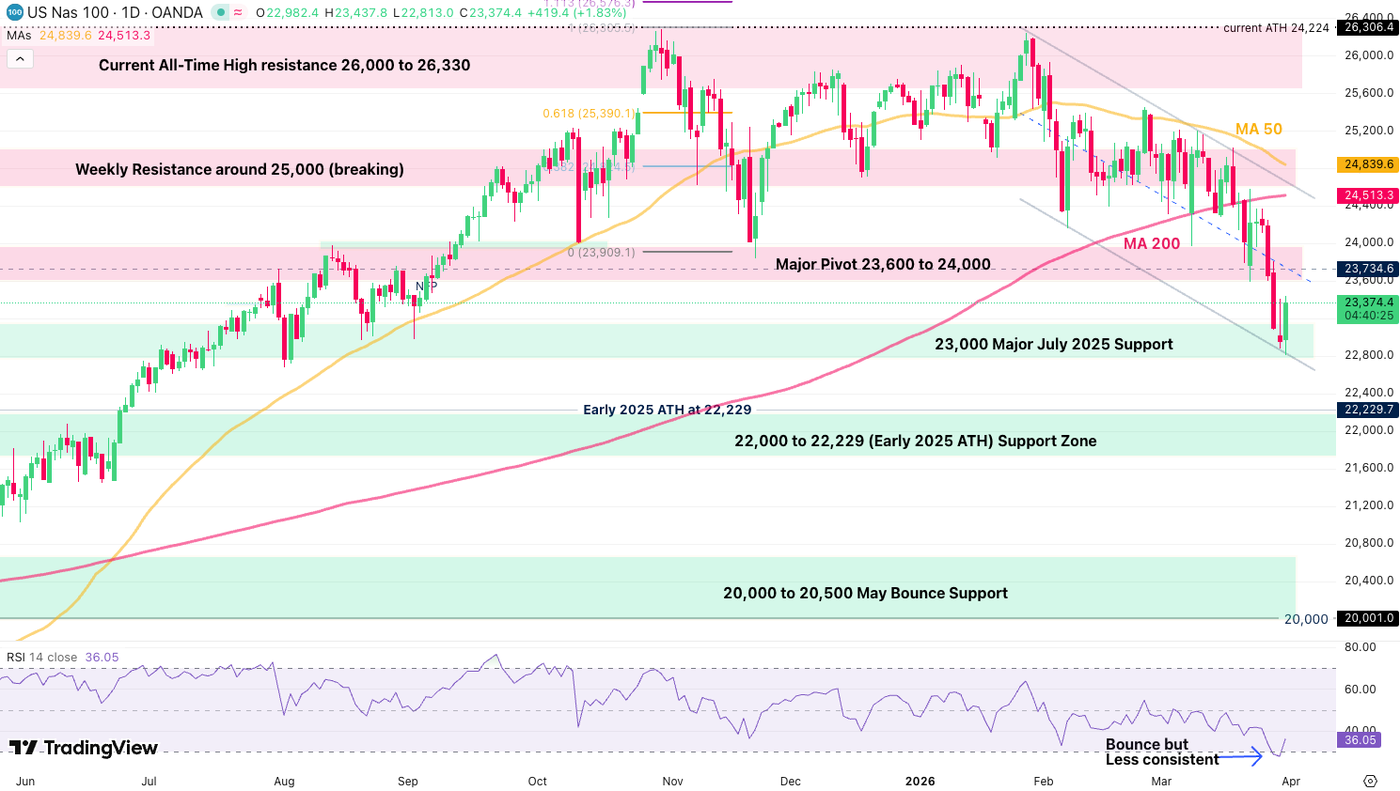
Nasdaq is rebounding steeply after reaching levels not seen since July 2025 at 22,800.
The price action certainly less bullish compared to the Dow Jones, by having failed to form a bull divergence on its daily RSI, and seeing relative weakness in recent trading.
This would hint at Nasdaq underperformance in coming weeks even if the War brings further optimism in Markets (rotation towards more defensive).
Still, this doesn’t prevent to hunt for interesting Tech individual stocks that have seen heavy discounts since late 2025.
The most discouraging development for Nasdaq, to keep your eyes on in coming days, is the potential Death-Cross that seems to be forming (50-Day MA crossing the 200-Day MA). Tracked by large investors, this may provide further danger in the Index.
To check out intraday technical levels, check out our past day analysis!
Nasdaq Daily technical levels of interest:
Daily Resistance Levels
- Major Daily Pivot 23,600 to 24,000 (more neutral above)
- Minor resistance at 23,750 (bear channel mid-level)
- Major 50 and 200-Day Moving averages ~24,500
- Current All-Time High resistance 26,000 to 26,330
Daily Support Levels
- 23,000 Major July 2025 Support and War lows
- 22,000 to 22,229 (Early 2025 ATH) Support Zone
- 21,000 Psychological minor Support
- 20,000 to 20,500 May Bounce Support
- 16,335 – Liberation Day 2025 Lows
S&P 500 Daily Chart and Trading Levels
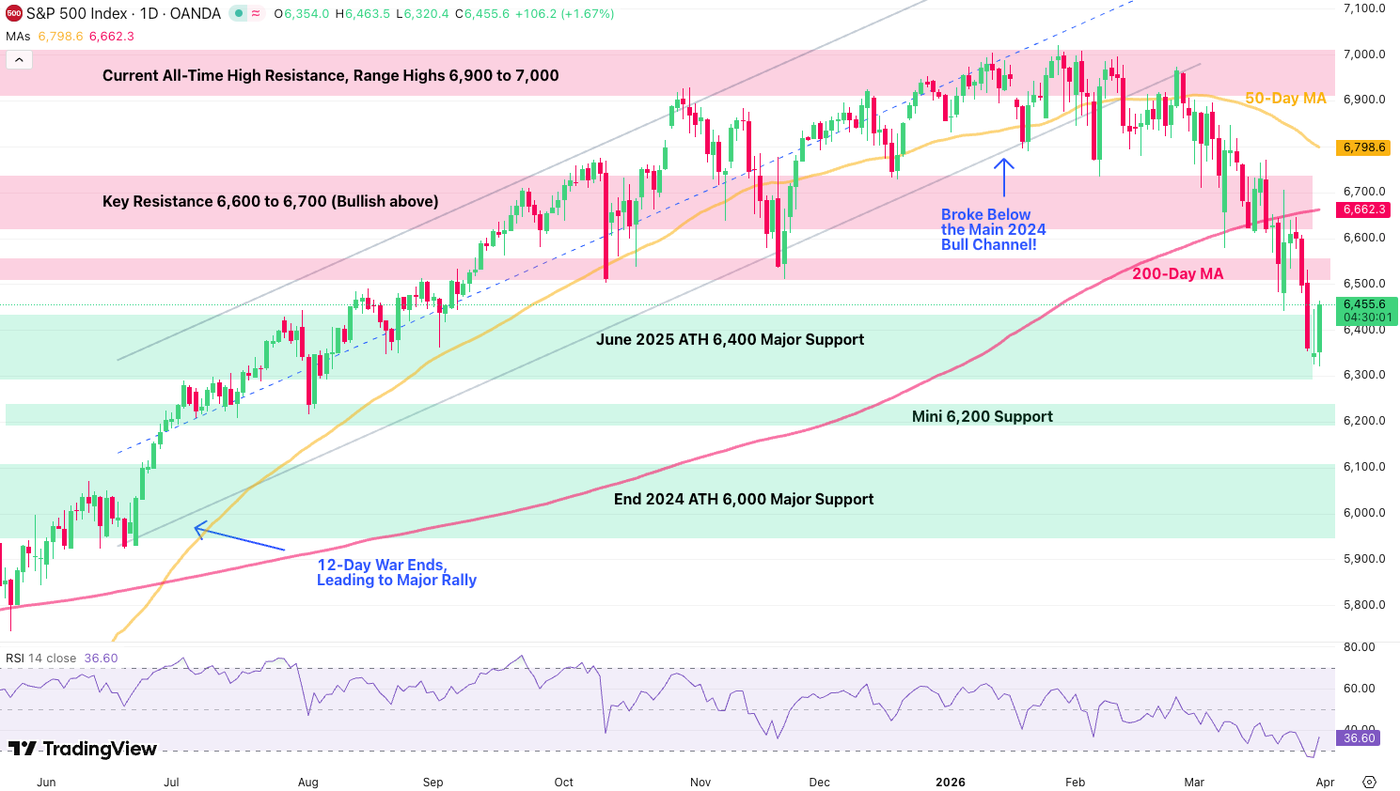
The S&P 500 is subject to less aggravating technical pressure than the Nasdaq, but also hasn’t formed as consistent of a rebound as the DJIA.
Still, bouncing on a key support at 6,300 to 6,400, slow and steady dip-buying would be sensical.
Above 6,560, the path for a return to further bullishness is clear, as this would also coincide with a breakout from the Index’s War downtrend. War lows are at 6,300, hence watch out if they break.
To check out intraday technical levels, check out our past day analysis!
S&P 500 Daily technical levels of interest:
Resistance Levels
- Mini 6,500 to 6,560 Resistance
- 6,570 to 6,600 Pivotal intraday resistance
- Major Key Resistance 6,600 to 6,700 (Bullish above)
- 50-Day MA 6,800
- Current All-Time High Resistance, Range Highs 6,900 to 7,000
DailySupport Levels
- June 2025 ATH 6,300 to 6,400 Major Support and current Lows
- Mini 6,200 Support
- End 2024 ATH 6,000 Major Support
- July 2024 5,500 Mini-Support
- 4,812 Liberation Day lows
Safe Trades and Keep track of headlines!
Follow Elior on Twitter/X for Additional Market News, interactions and Insights @EliorManier
Opinions are the authors’; not necessarily that of OANDA Business Information & Services, Inc. or any of its affiliates, subsidiaries, officers or directors. The provided publication is for informational and educational purposes only.
If you would like to reproduce or redistribute any of the content found on MarketPulse, an award winning forex, commodities and global indices analysis and news site service produced by OANDA Business Information & Services, Inc., please refer to the MarketPulse Terms of Use.
Visit https://www.marketpulse.com/ to find out more about the beat of the global markets.
© 2026 OANDA Business Information & Services Inc.
About the Author

Elior Manier
Market Analyst
Elior brings over seven years of experience in financial markets to our analyst team. Since 2018, he has actively engaged in observing, charting, and trading, driven by his passion for mastering market dynamics. With a profound understanding of the geopolitical and macroeconomic forces that shape market movements, Elior focuses on analysing the impact of breaking news, market sentiment, and critical economic data releases on trading flows.
As a versatile analyst, he contributes powerful insights to the team, effectively integrating geopolitical and technical analysis to provide clear and comprehensive market perspectives.
Prior to joining our team, Elior honed his expertise as a Fixed Income Trader and Market Analyst at the Montreal Exchange.


![i’m-nervous,-too!-[part-2]](https://10xwealthreport.com/wp-content/uploads/2026/03/177042-im-nervous-too-part-2-1568x784.jpg)