Mosaic (NYSE:MOS) has had a rough month with its share price down 9.8%. But if you pay close attention, you might gather that its strong financials could mean that the stock could potentially see an increase in value in the long-term, given how markets usually reward companies with good financial health. Specifically, we decided to study Mosaic’s ROE in this article.
Return on equity or ROE is an important factor to be considered by a shareholder because it tells them how effectively their capital is being reinvested. Put another way, it reveals the company’s success at turning shareholder investments into profits.
Check out our latest analysis for Mosaic
How To Calculate Return On Equity?
ROE can be calculated by using the formula:
Return on Equity = Net Profit (from continuing operations) ÷ Shareholders’ Equity
So, based on the above formula, the ROE for Mosaic is:
11% = US$1.4b ÷ US$12b (Based on the trailing twelve months to September 2023).
The ‘return’ is the amount earned after tax over the last twelve months. So, this means that for every $1 of its shareholder’s investments, the company generates a profit of $0.11.
Why Is ROE Important For Earnings Growth?
So far, we’ve learned that ROE is a measure of a company’s profitability. We now need to evaluate how much profit the company reinvests or “retains” for future growth which then gives us an idea about the growth potential of the company. Assuming all else is equal, companies that have both a higher return on equity and higher profit retention are usually the ones that have a higher growth rate when compared to companies that don’t have the same features.
A Side By Side comparison of Mosaic’s Earnings Growth And 11% ROE
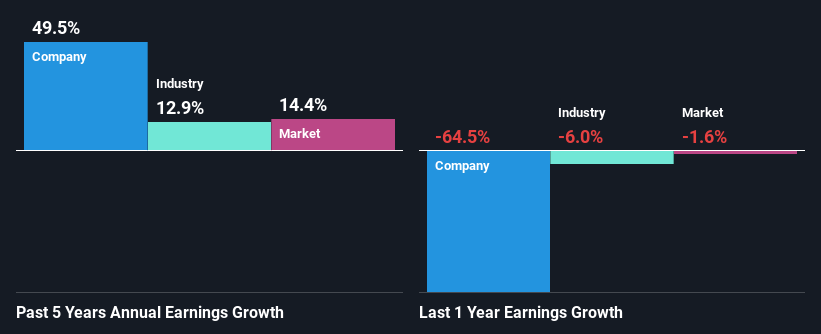
To start with, Mosaic’s ROE looks acceptable. Further, the company’s ROE is similar to the industry average of 14%. Consequently, this likely laid the ground for the impressive net income growth of 50% seen over the past five years by Mosaic. We believe that there might also be other aspects that are positively influencing the company’s earnings growth. For instance, the company has a low payout ratio or is being managed efficiently.
We then compared Mosaic’s net income growth with the industry and we’re pleased to see that the company’s growth figure is higher when compared with the industry which has a growth rate of 13% in the same 5-year period.
Earnings growth is a huge factor in stock valuation. The investor should try to establish if the expected growth or decline in earnings, whichever the case may be, is priced in. By doing so, they will have an idea if the stock is headed into clear blue waters or if swampy waters await. What is MOS worth today? The intrinsic value infographic in our free research report helps visualize whether MOS is currently mispriced by the market.
Is Mosaic Efficiently Re-investing Its Profits?
Mosaic’s ‘ three-year median payout ratio is on the lower side at 6.4% implying that it is retaining a higher percentage (94%) of its profits. So it looks like Mosaic is reinvesting profits heavily to grow its business, which shows in its earnings growth.
Additionally, Mosaic has paid dividends over a period of at least ten years which means that the company is pretty serious about sharing its profits with shareholders. Upon studying the latest analysts’ consensus data, we found that the company’s future payout ratio is expected to rise to 26% over the next three years. Consequently, the higher expected payout ratio explains the decline in the company’s expected ROE (to 6.8%) over the same period.
Conclusion
In total, we are pretty happy with Mosaic’s performance. Specifically, we like that the company is reinvesting a huge chunk of its profits at a high rate of return. This of course has caused the company to see substantial growth in its earnings. That being so, according to the latest industry analyst forecasts, the company’s earnings are expected to shrink in the future. Are these analysts expectations based on the broad expectations for the industry, or on the company’s fundamentals? Click here to be taken to our analyst’s forecasts page for the company.
Valuation is complex, but we’re helping make it simple.
Find out whether Mosaic is potentially over or undervalued by checking out our comprehensive analysis, which includes fair value estimates, risks and warnings, dividends, insider transactions and financial health.
Have feedback on this article? Concerned about the content? Get in touch with us directly. Alternatively, email editorial-team (at) simplywallst.com.
This article by Simply Wall St is general in nature. We provide commentary based on historical data and analyst forecasts only using an unbiased methodology and our articles are not intended to be financial advice. It does not constitute a recommendation to buy or sell any stock, and does not take account of your objectives, or your financial situation. We aim to bring you long-term focused analysis driven by fundamental data. Note that our analysis may not factor in the latest price-sensitive company announcements or qualitative material. Simply Wall St has no position in any stocks mentioned.