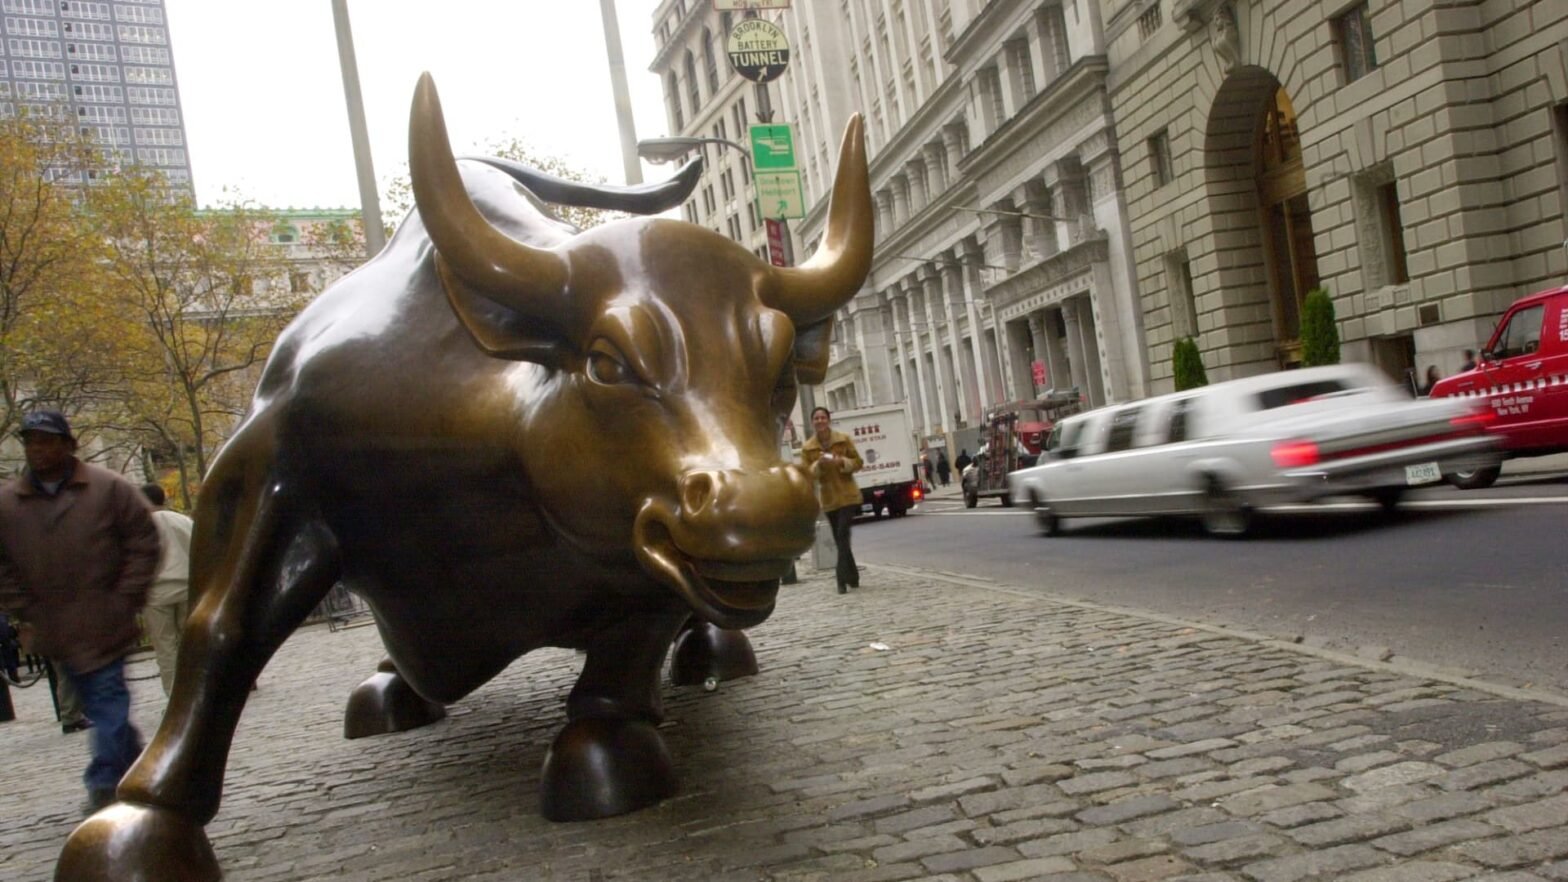
U.S. stocks could fall sharply as high valuations collide with economic headwinds created by President Trump’s tariffs.
The S&P 500 (^GSPC 1.04%) has traded sideways this year, while the iShares MSCI ACWI ex US ETF (a benchmark for global markets outside the United States) has advanced about 10%. The S&P 500 has not underperformed that badly in 30 years, according to Charles Schwab strategist Kevin Gordon.
What’s behind the mismatch? High valuations and concerns about President Trump’s policies have pushed investors away from U.S. stocks, and Trump recently doubled down on his tariffs strategy.

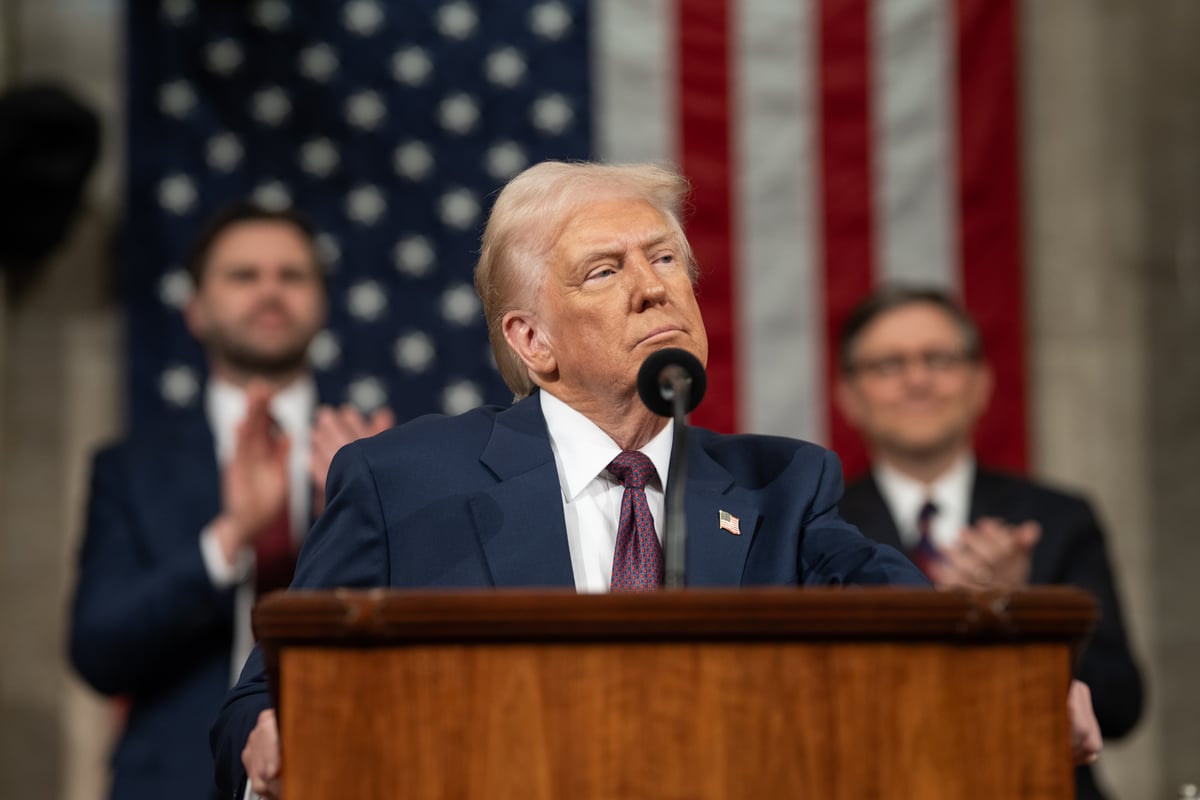
Image source: Official White House Photo.
President Trump has replaced now-illegal IEEPA tariffs with similar Section 122 tariffs
Last year, President Trump invoked the International Emergency Economic Powers Act (IEEPA) to impose tariffs ranging from 10% to 50% on goods imported from most countries. He also used Section 232 of the Trade Expansion Act of 1962 to impose tariffs on various products and sectors, including steel, aluminum, cars, auto parts, and lumber.
Last week, the Supreme Court struck down the IEEPA tariffs, ruling the president had exceeded his authority. But Trump promptly announced a 10% global tariff (that he raised to 15% a day later) using Section 122 of the Trade Act of 1974. The Budget Lab at Yale estimates the average tax on U.S. imports before and after the Supreme Court ruling at 16% and 13.7%, respectively.
Here’s the big picture: President Trump has replaced IEEPA tariffs with similar ones. While Section 122 duties expire after 150 days unless Congress extends them, they still buy Trump time to impose more permanent tariffs under Section 301 of the Trade Act of 1974, which requires thorough investigations.
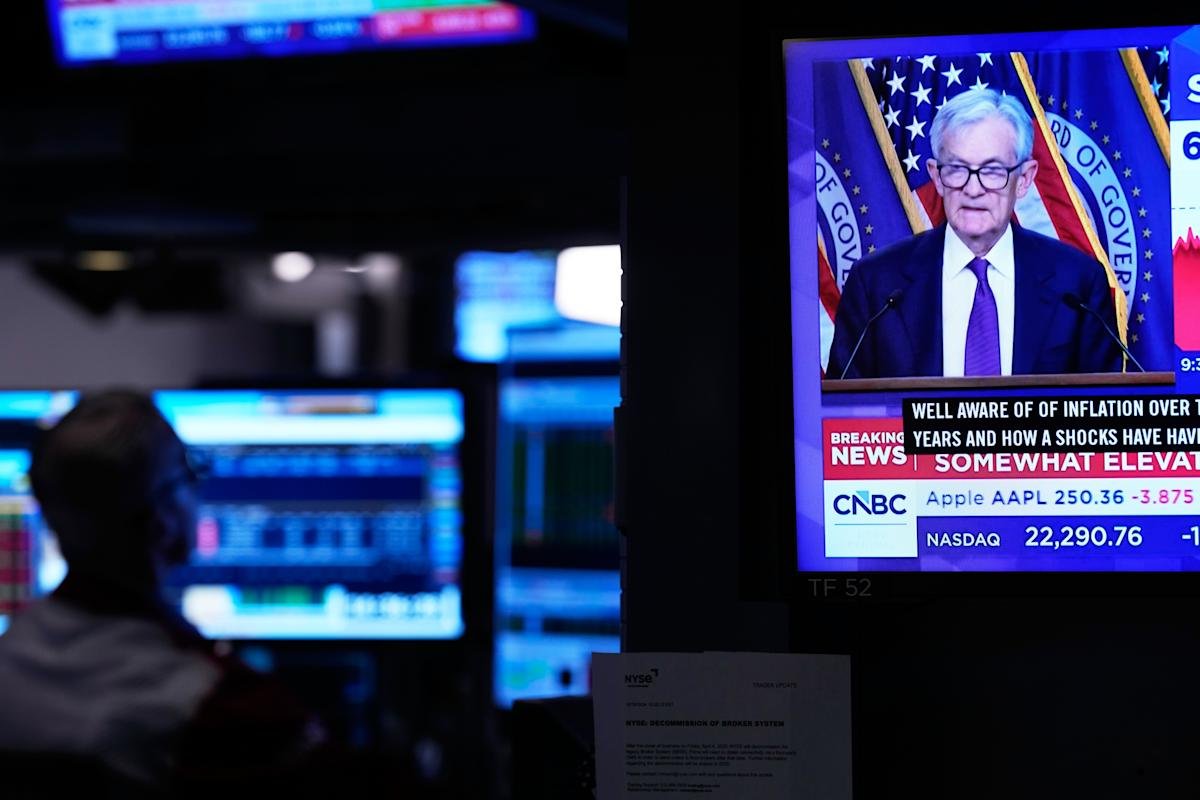
Recent data suggests President Trump’s tariffs have hurt the economy
Studies conducted by several institutions — the Congressional Budget Office (CBO), the Federal Reserve Bank of New York, the Kiel Institute, and the National Bureau of Economic Research — have arrived at the same conclusion: U.S. businesses and consumers have paid the vast majority of President Trump’s tariffs, with most research putting the figure around 90%.
Why does that matter? Each dollar in tariffs the government collects from U.S. businesses and consumers is money that could have been spent elsewhere to support the economy. That means gross domestic product (GDP) will be lower than it otherwise would have been had tariffs never been imposed, according to the CBO.
The drag on economic growth is already showing up in data. In 2025, the U.S. economy added only 181,000 jobs, the lowest number (excluding the pandemic) since 2009. And the economy expanded just 2.2%, the slowest growth (excluding the pandemic) in a decade. Meanwhile, PCE inflation (the Federal Reserve’s preferred measure) hit 2.9% in December 2025, the highest reading since March 2024.
The stock market sounds an alarm last seen during the dot-com crash
The S&P 500 recorded an average cyclically adjusted price-to-earnings (CAPE) ratio of 40.2 in January 2026, the highest reading since the dot-com crash in September 2000. In fact, since its inception in 1957, the S&P 500 has only recorded a monthly CAPE ratio above 40 on 21 other occasions, meaning the index has been this expensive less than 3% of the time throughout history.
Economist Robert Shiller developed the CAPE ratio to determine whether entire stock market indexes were overvalued. Historically, multiples higher than 40 have correlated with dismal forward returns in the S&P 500, as shown in the table below.
|
Time Period |
S&P 500’s Average Return |
|---|---|
|
Six months |
0% |
|
One year |
(3%) |
|
Two years |
(19%) |
|
Three years |
(30%) |
Data source: Robert Shiller. Table by author.
The table provides a grim outlook for the U.S. stock market. If the S&P 500 performs in line with the historical average, the index will decline 3% by February 2027, 19% by February 2028, and 30% by February 2029.
Of course, past performance is not a guarantee of future returns. The CAPE ratio is a backward-looking metric, so it does not account for a potential uplift in profit margins driven by the adoption of artificial intelligence. (AI). Earnings may grow quickly enough in the future that the S&P 500 continues to climb higher while its CAPE ratio falls to a more reasonable number.
Even so, investors would be remiss to completely ignore this warning sign. The current market environment warrants caution, especially because tariffs could become a more significant drag on the economy.
Do not buy stocks you would feel uncomfortable holding through a prolonged downturn. Instead, focus on stocks trading at sensible prices whose earnings are likely to be substantially higher five years (or even 10 years) from now.

![i’m-nervous,-too!-[part-2]](https://10xwealthreport.com/wp-content/uploads/2026/03/177042-im-nervous-too-part-2-1568x784.jpg)