

f9photos/iStock via Getty Images
The S&P 500 (SP500) and a few of its key sectors have reached over-bought levels based on a few technical indicators suggesting that this market is overextended from a technical standpoint at a time when the dynamics of the options market are flashing warning signs all over the place, and expected future returns plunge.
As discussed previously, the options market has helped push the equity market to these overbought levels daily, weekly, and monthly. But the dynamics of these overbought conditions are shifting, and the window for a significant market decline is not only open, but the time for the unwind appears to be in progress.
The overbought levels in the S&P 500 can be seen on the daily and weekly chart by looking at the relative strength index, which climbed above 70 during the middle of last week. It isn’t often that the S&P 500 sees its RSI rise above 70 on the weekly chart. It only happened once during the rally of 2023 and before that you have to go back to late 2021.

TradingView
These conditions are also present in sectors like Semiconductors, with the VanEck Semiconductor ETF (SMH) also seeing its RSI on the weekly chart climb above 70. That decisive move in the sector likely reflects the big move higher in stocks like Nvidia (NVDA) and AMD (AMD). In addition to the SMH ETF seeing its RSI rise above 70, it has also seen its price rise above the upper Bollinger band, another overbought condition on the weekly chart.

TradingView
The Communication Services Select Sector SPDR (XLC) ETF also finds itself similarly positioned, with the RSI climbing to more than 77 last week. At the same time, the price closed above the upper Bollinger band, also flashing the conditions of being overbought on two separate indicators. The move higher in the XLC is likely a reflection of the strong performance of Meta (META)

TradingView
The SPDR Select Sector Technology ETF (XLK) has reached similar overbought levels, but only with the RSI climbing above 70. Unlikely, the other has not seen its price rise above the upper Bollinger band. So, while the ETF could be considered overbought based on the relative strength index, it doesn’t present the same overall exuberance.

TradingView
Options Flows
These overbought conditions appear to reflect, in some cases, the positioning in the market in select stocks that make up some of these sectors. It could also result from the implied volatility dispersion trade discussed previously and option hedging flows that had been very supportive of the shares over the last few months.
But with the big January options expiration date and significant earnings behind us, those supportive hedging flows should be diminished and implied volatility levels across the mega-cap stocks have now fallen too sharply lower levels.
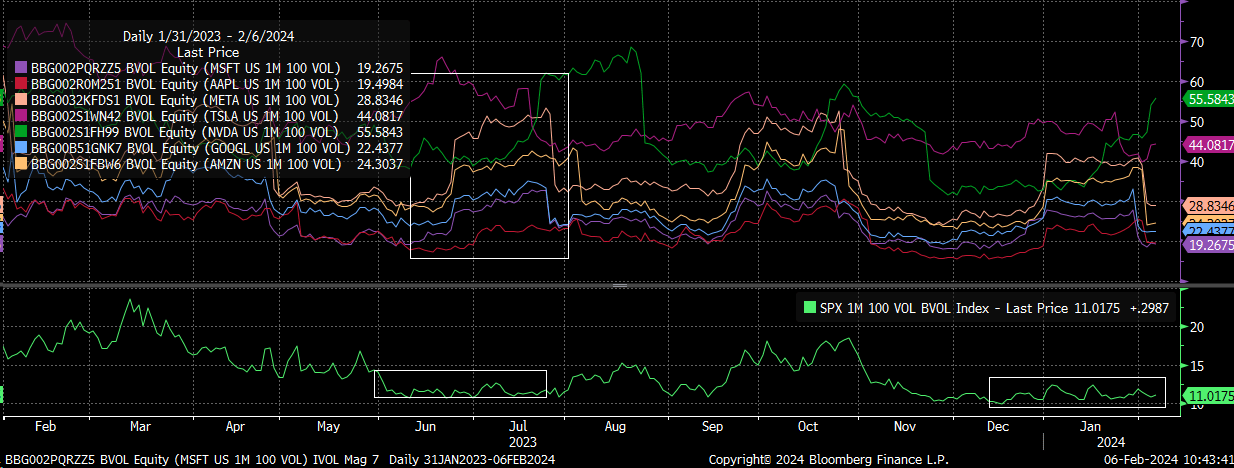
Bloomberg
It has led the 1-month implied correlation index to rise off its recent lows after challenging the levels last seen in July 2023 and parts of 2017 and 2018- periods that also saw stretched sentiment, such as in January 2018. Usually, when the implied correlation index rises, the S&P 500 reverses its gains and heads lower, as has been the case in the past.

TradingView
When the implied correlation index falls, the implied volatility of the S&P 500 moves in the opposite direction of the components in the S&P 500. When the implied correlation index rises, it is a function of the implied volatility of both the index and basket of stocks moving in the same direction and being more correlated.
So, at least on the surface, the current overbought reading on the S&P 500 and a few sectors, mainly the ones that have the most significant impact on the implied volatility dispersion trade, appears to signal that the market has reached an overextended position.
It doesn’t have to mean that stock prices and indexes fall; it could result in the index marking time and consolidating sideways. However, valuation and growth rates suggest the market could see a significant pullback.
Expected Market Returns Plunge
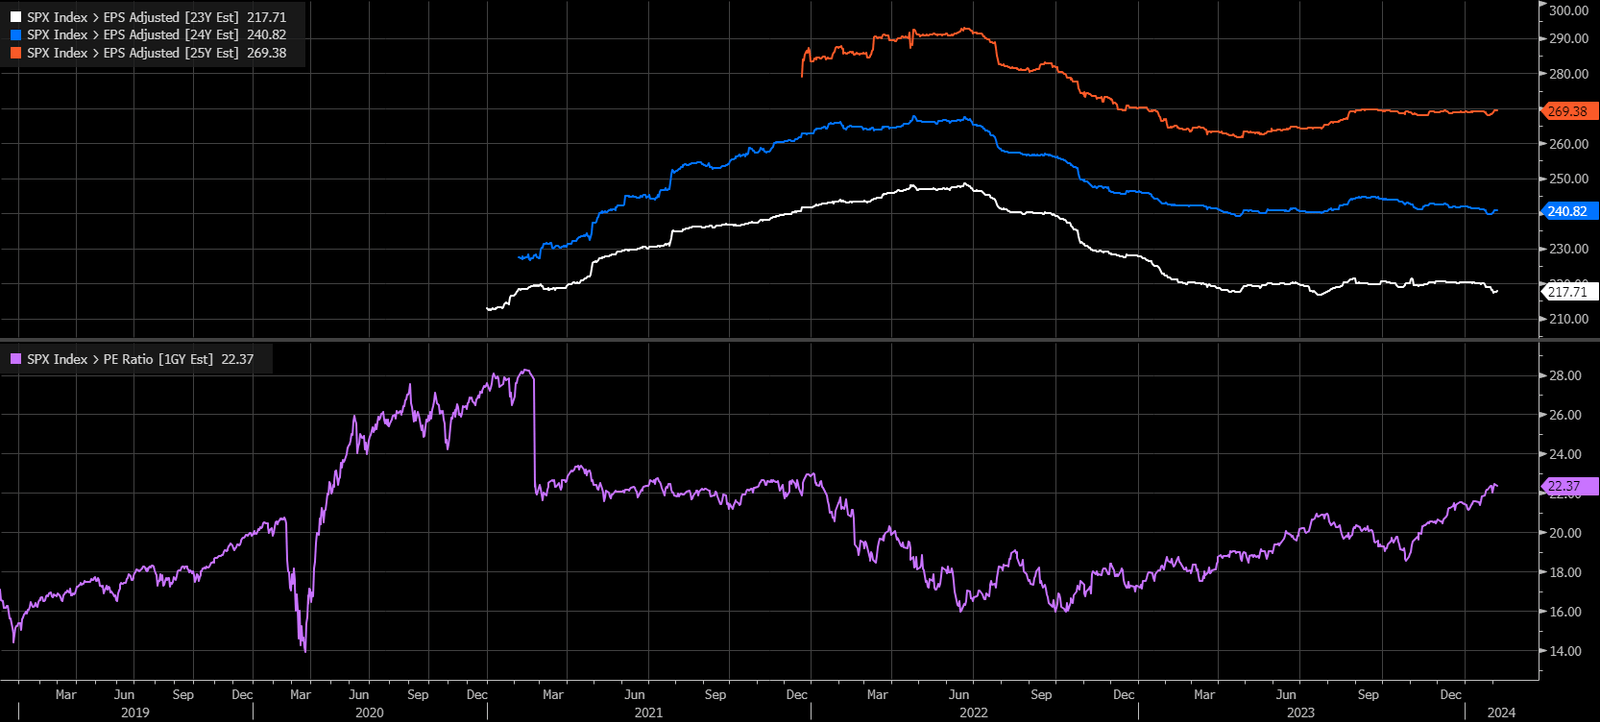
The S&P 500 is trading at more than 22 times 2024 earnings estimates, which puts it back at levels last seen in 2021 when interest rates were near zero and the Fed was conducting QE. This is opposed to the overnight Fed Funds rate now being more than 525 bps higher, as the Fed is running quantitative tightening.
TradingView
Meanwhile, the spread between the last twelve months’ earnings yield and the 10-year rate has contracted to just 35 bps. That is the narrowest the spread has been since the 1990s and is associated with a time of falling interest rates, not during a time of rising interest, such as in the 1960s and 1970s.

TradingView
Additionally, the expected market returns have plummeted. In the past, changes in market expected returns have, at times, acted as a leading indicator of the direction of the S&P 500. It could be that the significant gains witnessed in the broader indexes and many market sectors have pulled forward future returns.

TradingView
All of this seems to point to an overheated market that needs a big reset, which appears to be already in motion.
This article was written by
Analyst’s Disclosure: I/we have no stock, option or similar derivative position in any of the companies mentioned, and no plans to initiate any such positions within the next 72 hours. I wrote this article myself, and it expresses my own opinions. I am not receiving compensation for it (other than from Seeking Alpha). I have no business relationship with any company whose stock is mentioned in this article.
Charts used with the permission of Bloomberg Finance L.P. This report contains independent commentary to be used for informational and educational purposes only. Michael Kramer is a member and investment adviser representative with Mott Capital Management. Mr. Kramer is not affiliated with this company and does not serve on the board of any related company that issued this stock. All opinions and analyses presented by Michael Kramer in this analysis or market report are solely Michael Kramer’s views. Readers should not treat any opinion, viewpoint, or prediction expressed by Michael Kramer as a specific solicitation or recommendation to buy or sell a particular security or follow a particular strategy. Michael Kramer’s analyses are based upon information and independent research that he considers reliable, but neither Michael Kramer nor Mott Capital Management guarantees its completeness or accuracy, and it should not be relied upon as such. Michael Kramer is not under any obligation to update or correct any information presented in his analyses. Mr. Kramer’s statements, guidance, and opinions are subject to change without notice. Past performance is not indicative of future results. Neither Michael Kramer nor Mott Capital Management guarantees any specific outcome or profit. You should be aware of the real risk of loss in following any strategy or investment commentary presented in this analysis. Strategies or investments discussed may fluctuate in price or value. Investments or strategies mentioned in this analysis may not be suitable for you. This material does not consider your particular investment objectives, financial situation, or needs and is not intended as a recommendation appropriate for you. You must make an independent decision regarding investments or strategies in this analysis. Upon request, the advisor will provide a list of all recommendations made during the past twelve months. Before acting on information in this analysis, you should consider whether it is suitable for your circumstances and strongly consider seeking advice from your own financial or investment adviser to determine the suitability of any investment.
Seeking Alpha’s Disclosure: Past performance is no guarantee of future results. No recommendation or advice is being given as to whether any investment is suitable for a particular investor. Any views or opinions expressed above may not reflect those of Seeking Alpha as a whole. Seeking Alpha is not a licensed securities dealer, broker or US investment adviser or investment bank. Our analysts are third party authors that include both professional investors and individual investors who may not be licensed or certified by any institute or regulatory body.


![i’m-nervous,-too!-[part-2]](https://10xwealthreport.com/wp-content/uploads/2026/03/177042-im-nervous-too-part-2-1568x784.jpg)