Certain economic data can tell investors a lot about the state of the economy, which can significantly impact the market.
Economists, analysts, and market watchers are constantly examining different types of economic data to find patterns that could indicate a change in the stock market. One key economic signal the market follows closely is called the yield curve, which maps the varying yields that Treasury bills of different maturities pay at any given point in time. Not long ago, the yield curve did something for the first time in 793 days, or more than 26 months, that could signal a big move for the stock market. Here’s what the yield curve may be trying to tell us.
What is the yield curve really?
The yield curve plots the different yields of Treasury bills of different maturities from just a few months to 30 years on any given day, as Treasury yields change constantly. A normal yield curve looks like this with the line forming a path created by various points on the grid:

Image source: Getty Images.
Under a normal yield curve, the smallest-duration Treasury bills yield the least, and the longest-duration bills yield the most. This makes sense because the dollar is always worth more today than in the future. That’s why if you lend money to the government for longer, it will normally have to yield more to entice buyers so they can recoup your investment after adjusting for inflation. A normalized yield curve is good for investors because their present-day borrowing rates are lower and they can invest in safe assets at higher rates long-term.
Treasury yields tend to have an inverse relationship with Treasury bills and their movements are affected by multiple factors, including economic growth, inflation, the Federal Reserve’s monetary policy and the federal funds rate, supply and demand, and investor sentiment. Depending on some of these factors, there are times when short-term Treasury bills can yield more than long-term ones. This is called an inverted yield curve, where the slope seen above is more S-shaped and certain low-duration T-bills yield more than some of the longer-duration bonds. If the inversion is severe, the path would start high on the yield axis (Y-axis) and gradually get lower as it spreads across the maturity axis (X-axis), forming a half-pipe-like swoop.
An inverted yield curve suggests the economy is in trouble because short-term borrowing is more expensive. Long-term yields also reflect the market’s view of economic growth and inflation, so lower long-term yields imply more pessimistic about the future.
What recently happened with the yield curve?
During the pandemic, inflation started to run rampant and the Federal Reserve realized that it likely wouldn’t be as transient as it had initially thought. It began raising interest rates to cool the economy, which jacked up short-term Treasury rates. Meanwhile, the market worried that the Fed’s aggressive hikes would tip the economy into a recession, contributing to declining long-term yields.
The yield curve officially became inverted in July 2022 and stayed that way for more than two years, marking the longest period of inversion ever and beating the previous record of 624 days in 1978. In early September, a closely watched part of the curve finally began to uninvert, specifically the yields on the two- and 10-year U.S. Treasury bills.
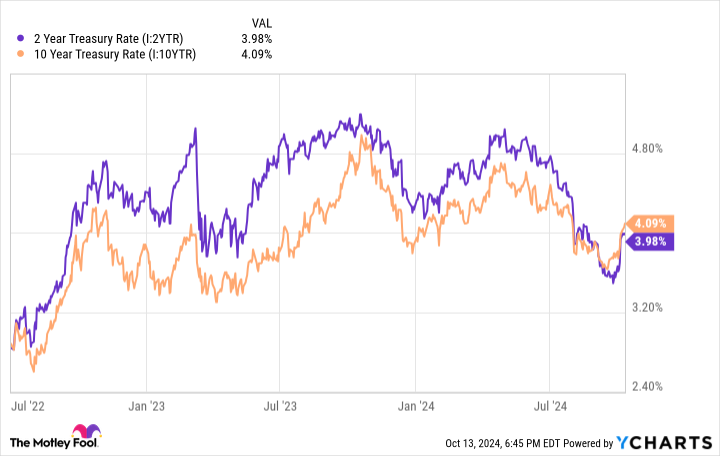
2 Year Treasury Rate data by YCharts
Why is this important
Investors don’t like to see an inverted yield curve because it has a nasty habit of foreshadowing a recession. However, the recession doesn’t necessarily take place while the curve is inverted. Typically, a recession occurs not long after the yield curve uninverts, right before the Fed begins to lower interest rates, and that just happened. The yield curve officially uninverted in early September, and the Fed announced its cuts later that month.
According to Barron’s, each of the last four recessions, which began in 1990, 2001, 2007, and 2020, all kicked off about three to six months after the yield curve was uninverted. Stocks tend to get hammered during a recession, with the broader market S&P 500 falling by more than 30% on average in the last 10 recessions.
Will history repeat itself?
Based on available economic data, there is no indication that the economy is heading for a recession. The labor market appears to be hanging in with the unemployment rate at 4.1% in September, and inflation is largely heading downward in the right direction.
Additionally, while the yield curve’s inversion reversal has been reliable, it hasn’t always triggered a recession — such as in 1966. Historical data is great to use for research and to get an idea of what could happen. But it can’t always predict the future. The economy is dealing with some factors that it never has before; for example, the COVID-19 pandemic has radically changed the way people live. There is also an unprecedented amount of money in the economy due to the Fed’s massive balance sheet, which has shrunk from all-time highs but is still larger than in the past.
So what can investors do with this information? Understand that even though things seem fine, a recession is still possible based on what has happened in the past. It may never materialize, but you should still assume there’s a small probability that one may occur — even if it’s moderate — and prepare appropriately.