

- US Stock Benchmarks rebound slightly with President Trump still attempting to calm Markets
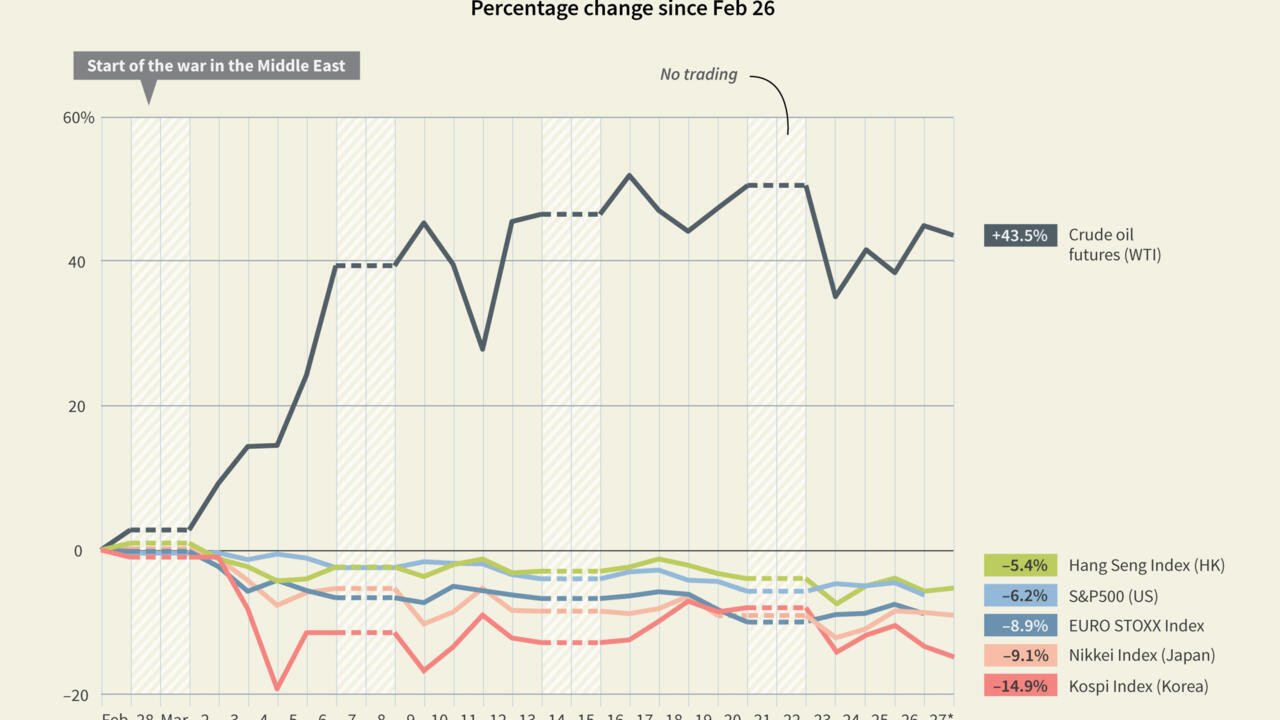
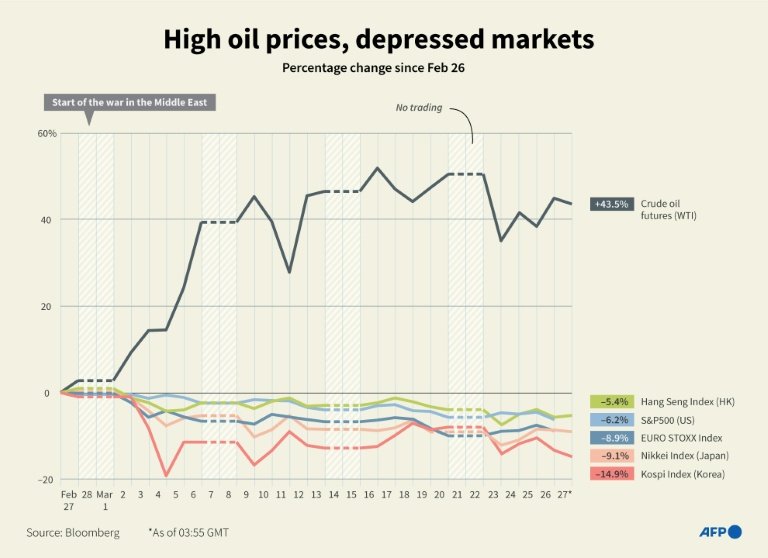
- Oil prices are still playing tricks on broader sentiment, with the conflict now entering its fifth week
- Exploring Technical Levels for the Dow Jones, Nasdaq and S&P 500
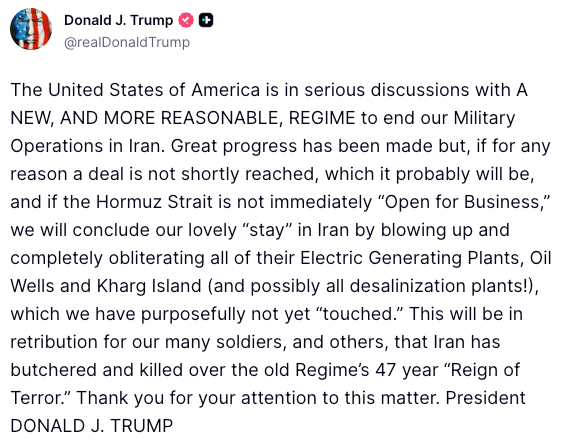
General sentiment has not worsened following President Trump’s attempts on Monday morning to ease concerns surrounding the current narrative.
As the conflict extends into its fifth week, skepticism grows regarding the initial deadline given for how long the operation would last. Investors are increasingly worried about the possibility that the situation may deteriorate further before it improves.
Over the weekend, the Pentagon announced preparations for a limited ground operation to conclude the ongoing war. This announcement evoked comparisons to the conflicts in Afghanistan and Iraq, though the President’s morning message on Truth Social helped alleviate some anxiety.
Fed Chair Jerome Powell just delivered a speech at a conference at Harvard, reiterating that the Federal Reserve is well-equipped to handle current challenges – He provided further insights into the impact of tariffs and expressed an optimistic outlook on the economy, which contributed to the ongoing extension higher in Stock Markets.
One of the better comments for investors came from the fact that the Fed Chair did not deem that Private Credit stress would contaminate other parts of the Financial System, a source of general concern in recent weeks.
Despite a rebound in WTI Crude prices above the symbolic $100 mark, along with a similar increase in the US dollar, Market Participants appear to be looking ahead.
All US benchmarks are rallying, with yields also easing across the board.
These upward movements will be welcomed after last week’s troubling market activity; However, stocks are not entirely out of trouble yet, and there is still a significant chance that this upward movement may just be a temporary retracement, especially in the absence of a long-term solution.
To gauge today’s market direction, let’s examine the intraday charts and trading levels for the major US indexes: the Dow Jones, Nasdaq, and S&P 500.
Current Session’s Stock Heatmap
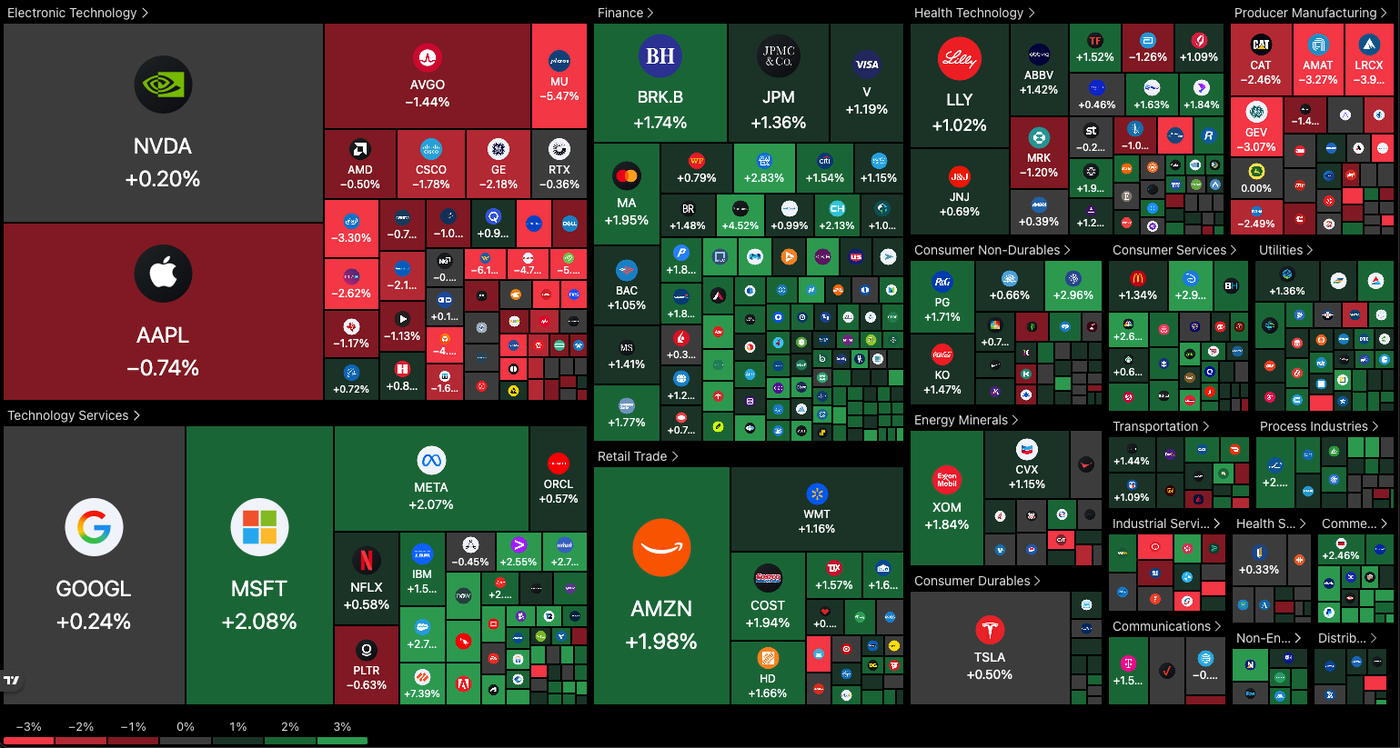
The rebound in today’s action is broad, but Tech and Producer Manufacturing, at both extremes of the traditional beta-spectrum, are the two laggards in general de-leveraging for the former and profit-taking for the latter.
Luckily for the general Market, some heavy names like Microsoft and Amazon are doing some heavy lifting and sustaining the general, more positive tone.
Dow Jones 4H Chart and Trading Levels
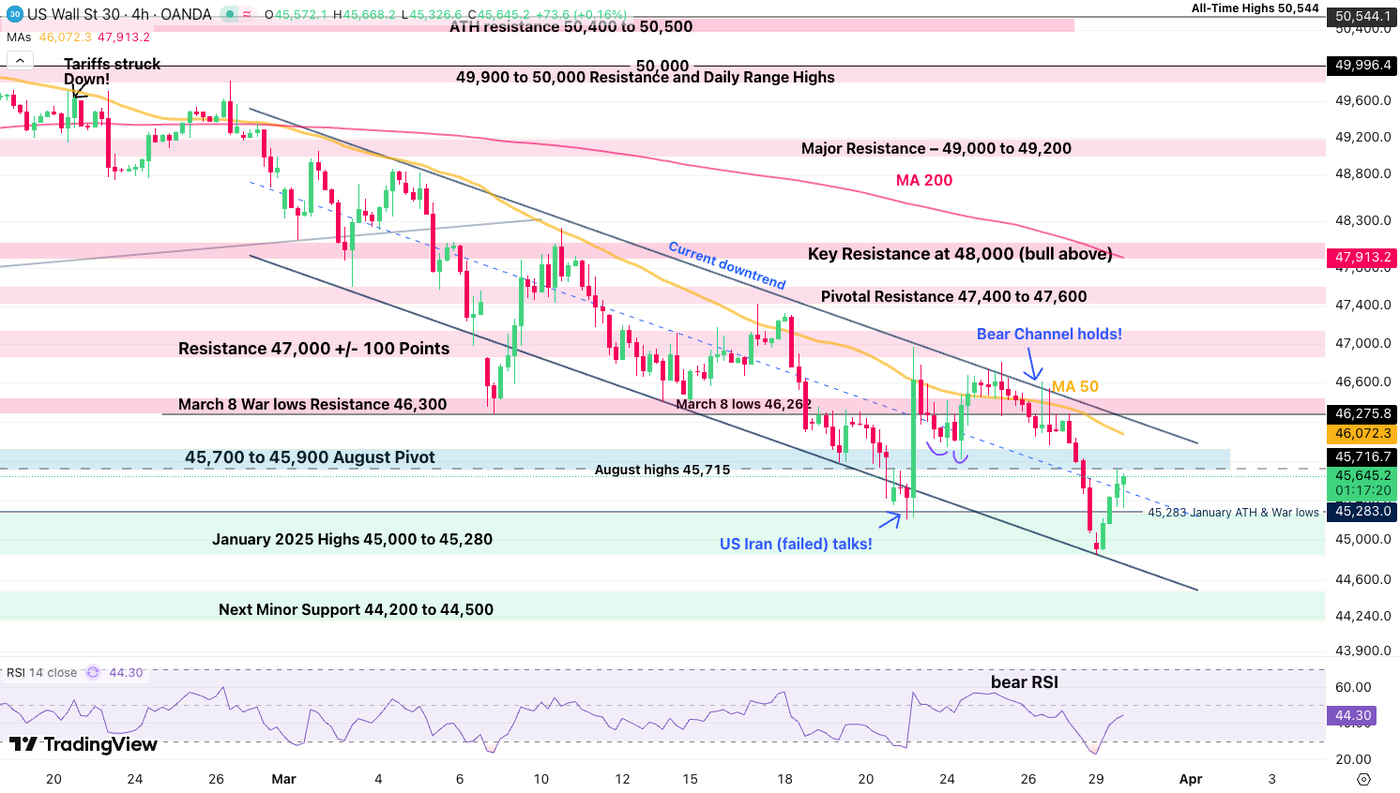
The Dow faked out below its January 2025 record level (45,280), notably holding the lower bound of its bear channel to the T.
The short-term action is indeed back into the bulls’ hands for the time being, with the mini-bullish hammer formation on the current 4H candle, but crossing above the Momentum Pivot (45,750) will be necessary to confirm the daily rebound.
Check out if buyers can actually manage a break of the channel’s upper bound (~46,270), as failing to do so would maintain the mid-term bearish trajectory – We are still at a very interesting longer-run pivot in Stock Markets (Daily Stock outlook coming up tomorrow).
Dow Jones technical levels for trading:
Resistance Levels
- 45,700 to 45,900 Momentum Pivot
- 46,270 Channel top and short-term resistance
- Resistance 47,000 +/- 100 Points (session highs and major resistance)
- Momentum Resistance 47,500 to 47,650
- Key Resistance at 48,000
Support Levels
- January 2025 Highs and War Lows 45,280
- Channel and Morning lows 44,840
- Next Minor Support 44,200 to 44,500
- Major Support 43,500 to 43,750
Nasdaq 4H Chart and Trading Levels
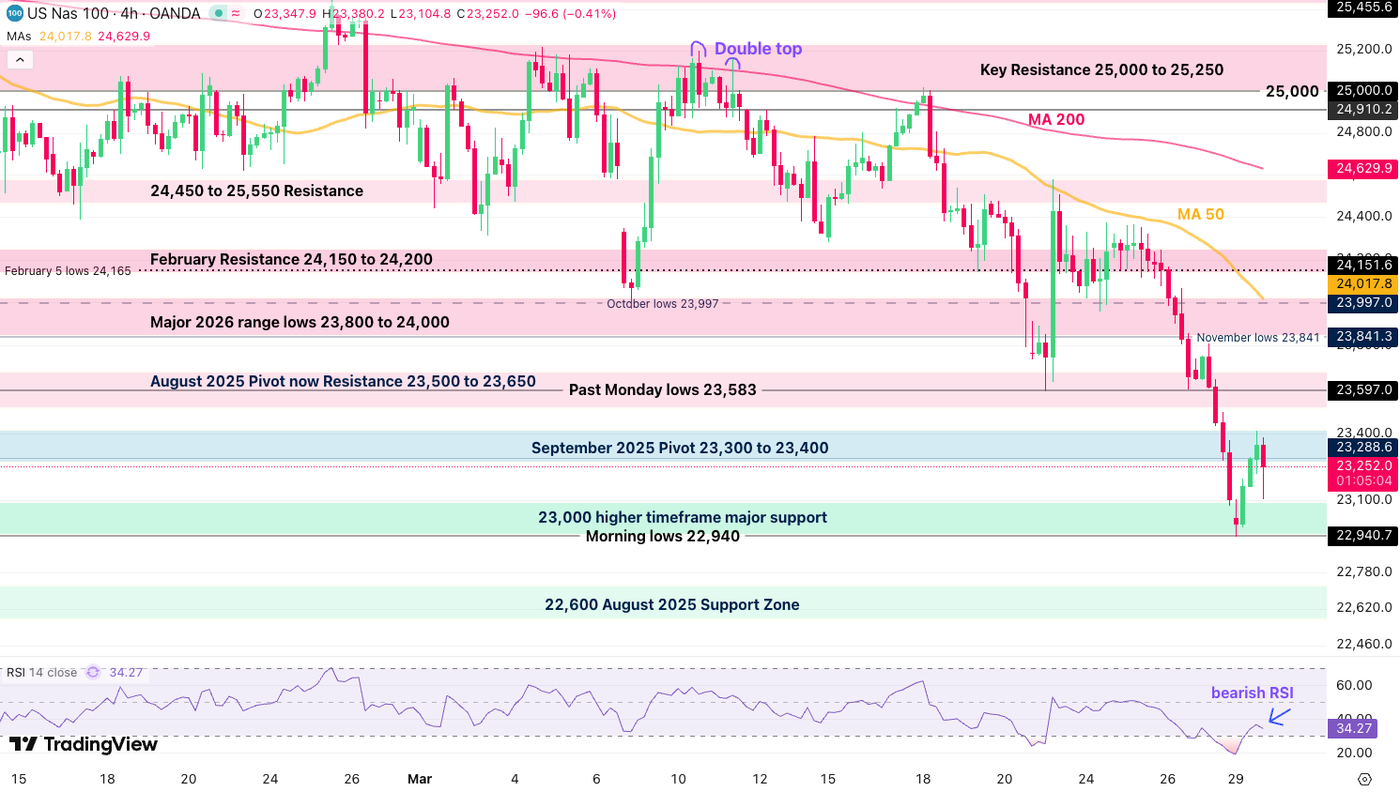
Nasdaq is in a rough stretch, tumbling 3% in last week’s action right below its major 23,000 Support.
Bulls are now attempting a rally from the area, but won’t be gaining much traction until they break and close above the past Monday lows (23,600) – Tech sales are back in action, so make sure to keep a cautious eye if looking for deals.
On the short-term, bulls will want to break 23,400, while bears will want to see a break and close below 22,940.
Nasdaq technical levels of interest:
Resistance Levels
- September 2025 Pivot 23,300 to 23,400
- August 2025 Pivot now Resistance 23,500 to 23,650
- Major 2026 range lows 23,800 to 24,000
- 24,450 to 25,550 resistance
- Key Resistance 25,000 to 25,200 (Range highs – Long-term Bullish above)
Support Levels
- 22,900 to 23,000 higher timeframe major support
- 22,600 August 2025 Support Zone
- Early 2025 ATH at 22,000 to 22,229 Support
S&P 500 2H Chart and Trading Levels
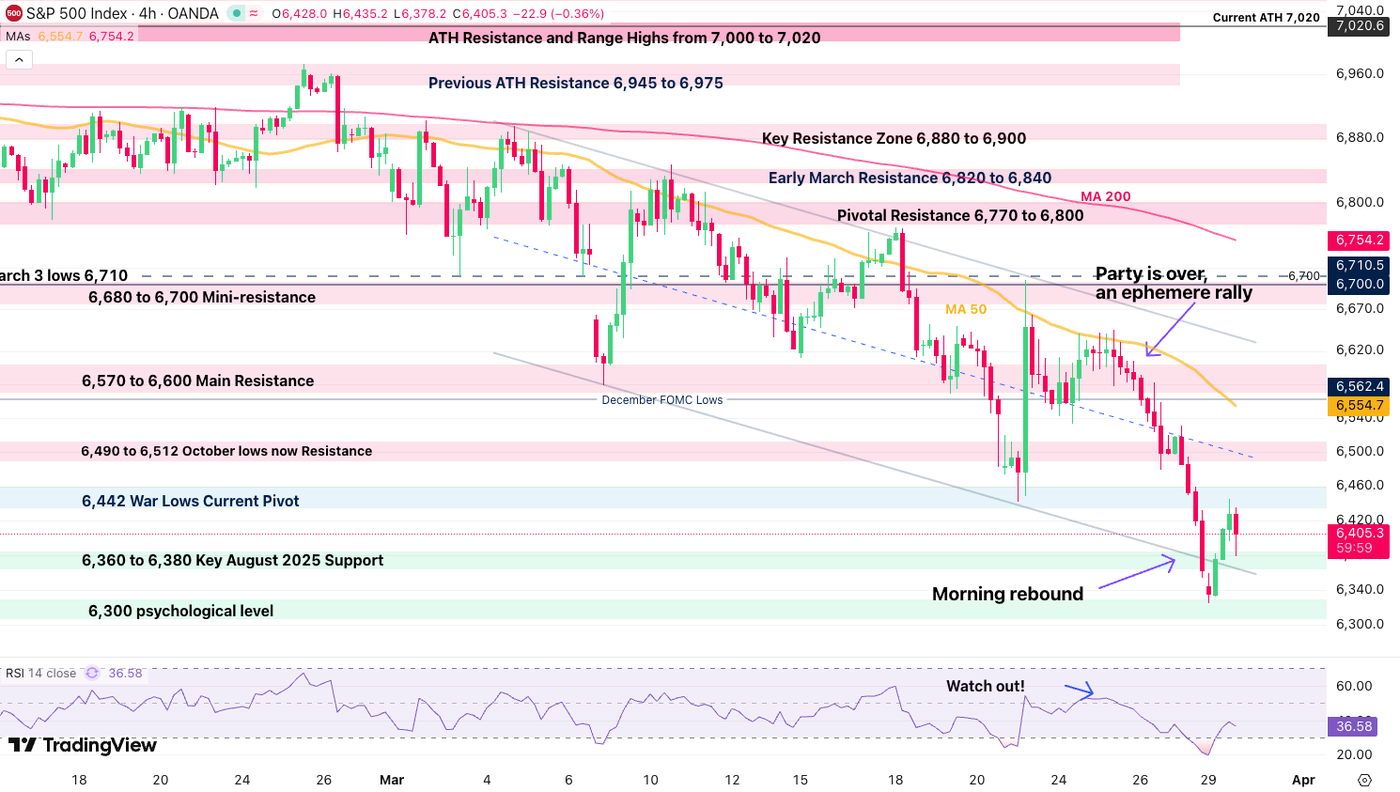
The S&P 500 wicked at its 6,300 Major psychological support, bouncing 100 points since but still not out of its long-term bearish price action.
After failing to generate a consistent move above the 6,450 pivot area, the action now looks quite confused, but still more favorable for a small rebound after the swift drop.
- A close above 6,440 would point to a more extended rally ahead
- The top 4H 5-period MA would be a first target
- Closing below 6,360 gives the advantage back to the bears
S&P 500 technical levels of interest:
Resistance Levels
- 6,442 War Lows Current Pivot (bullish above
- 6,570 to 6,600 Failed Double Bottom Pivotal resistance
- 6,680 to 6,700 Mini-resistance
- 6,740 Key intraday resistance
- Pivotal Resistance 6,770 to 6,800
Support Levels
- 6,360 to 6,380 Key August 2025 Support & Channel Lows
- 6,300 psychological level (morning lows)
- January 2025 ATH 6,152
Safe Trades and Keep track of headlines and Bitcoin over the weekend!
Follow Elior on Twitter/X for Additional Market News, interactions and Insights @EliorManier
Opinions are the authors’; not necessarily that of OANDA Business Information & Services, Inc. or any of its affiliates, subsidiaries, officers or directors. The provided publication is for informational and educational purposes only.
If you would like to reproduce or redistribute any of the content found on MarketPulse, an award winning forex, commodities and global indices analysis and news site service produced by OANDA Business Information & Services, Inc., please refer to the MarketPulse Terms of Use.
Visit https://www.marketpulse.com/ to find out more about the beat of the global markets.
© 2026 OANDA Business Information & Services Inc.
About the Author

Elior Manier
Market Analyst
Elior brings over seven years of experience in financial markets to our analyst team. Since 2018, he has actively engaged in observing, charting, and trading, driven by his passion for mastering market dynamics. With a profound understanding of the geopolitical and macroeconomic forces that shape market movements, Elior focuses on analysing the impact of breaking news, market sentiment, and critical economic data releases on trading flows.
As a versatile analyst, he contributes powerful insights to the team, effectively integrating geopolitical and technical analysis to provide clear and comprehensive market perspectives.
Prior to joining our team, Elior honed his expertise as a Fixed Income Trader and Market Analyst at the Montreal Exchange.


![i’m-nervous,-too!-[part-2]](https://10xwealthreport.com/wp-content/uploads/2026/03/177042-im-nervous-too-part-2-1568x784.jpg)