
With its stock down 4.3% over the past month, it is easy to disregard Weis Markets (NYSE:WMK). However, stock prices are usually driven by a company’s financials over the long term, which in this case look pretty respectable. Specifically, we decided to study Weis Markets’ ROE in this article.
Return on equity or ROE is an important factor to be considered by a shareholder because it tells them how effectively their capital is being reinvested. In other words, it is a profitability ratio which measures the rate of return on the capital provided by the company’s shareholders.
See our latest analysis for Weis Markets
How To Calculate Return On Equity?
Return on equity can be calculated by using the formula:
Return on Equity = Net Profit (from continuing operations) ÷ Shareholders’ Equity
So, based on the above formula, the ROE for Weis Markets is:
7.6% = US$104m ÷ US$1.4b (Based on the trailing twelve months to December 2023).
The ‘return’ is the amount earned after tax over the last twelve months. One way to conceptualize this is that for each $1 of shareholders’ capital it has, the company made $0.08 in profit.
What Has ROE Got To Do With Earnings Growth?
We have already established that ROE serves as an efficient profit-generating gauge for a company’s future earnings. Depending on how much of these profits the company reinvests or “retains”, and how effectively it does so, we are then able to assess a company’s earnings growth potential. Assuming all else is equal, companies that have both a higher return on equity and higher profit retention are usually the ones that have a higher growth rate when compared to companies that don’t have the same features.
Weis Markets’ Earnings Growth And 7.6% ROE
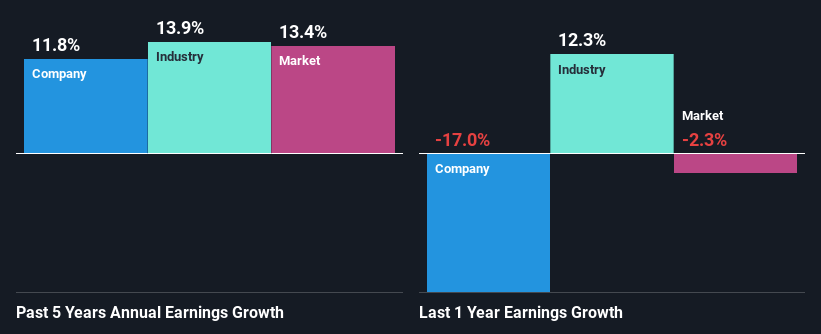
When you first look at it, Weis Markets’ ROE doesn’t look that attractive. We then compared the company’s ROE to the broader industry and were disappointed to see that the ROE is lower than the industry average of 16%. Weis Markets was still able to see a decent net income growth of 12% over the past five years. So, the growth in the company’s earnings could probably have been caused by other variables. For instance, the company has a low payout ratio or is being managed efficiently.
As a next step, we compared Weis Markets’ net income growth with the industry and found that the company has a similar growth figure when compared with the industry average growth rate of 14% in the same period.
Earnings growth is an important metric to consider when valuing a stock. What investors need to determine next is if the expected earnings growth, or the lack of it, is already built into the share price. By doing so, they will have an idea if the stock is headed into clear blue waters or if swampy waters await. If you’re wondering about Weis Markets”s valuation, check out this gauge of its price-to-earnings ratio, as compared to its industry.
Is Weis Markets Using Its Retained Earnings Effectively?
Weis Markets has a three-year median payout ratio of 30%, which implies that it retains the remaining 70% of its profits. This suggests that its dividend is well covered, and given the decent growth seen by the company, it looks like management is reinvesting its earnings efficiently.
Additionally, Weis Markets has paid dividends over a period of at least ten years which means that the company is pretty serious about sharing its profits with shareholders.
Conclusion
Overall, we feel that Weis Markets certainly does have some positive factors to consider. Despite its low rate of return, the fact that the company reinvests a very high portion of its profits into its business, no doubt contributed to its high earnings growth.
Valuation is complex, but we’re helping make it simple.
Find out whether Weis Markets is potentially over or undervalued by checking out our comprehensive analysis, which includes fair value estimates, risks and warnings, dividends, insider transactions and financial health.
Have feedback on this article? Concerned about the content? Get in touch with us directly. Alternatively, email editorial-team (at) simplywallst.com.
This article by Simply Wall St is general in nature. We provide commentary based on historical data and analyst forecasts only using an unbiased methodology and our articles are not intended to be financial advice. It does not constitute a recommendation to buy or sell any stock, and does not take account of your objectives, or your financial situation. We aim to bring you long-term focused analysis driven by fundamental data. Note that our analysis may not factor in the latest price-sensitive company announcements or qualitative material. Simply Wall St has no position in any stocks mentioned.