Over the last century, no asset class has been able to hold a candle to the annualized returns that stocks have brought to the table. Nevertheless, Wall Street still endures its fair share of volatility.
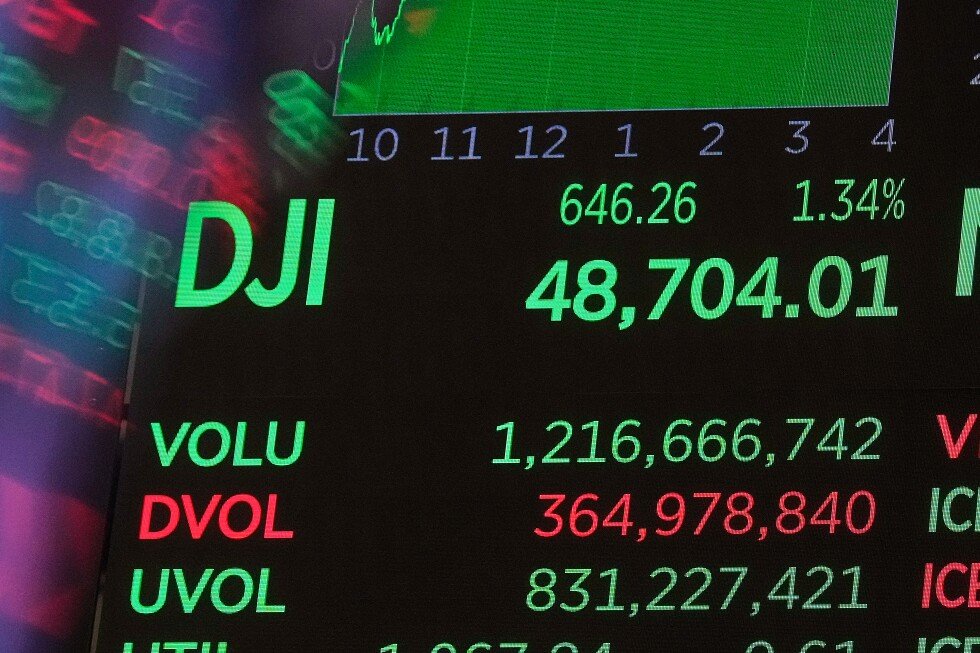
In a little over one month, the Dow Jones Industrial Average (^DJI 0.13%) and Nasdaq Composite (^IXIC +0.18%) have fallen into correction territory, with respective declines of 10.01% and 12.56% below their record-closing highs, through March 27. The broad-based S&P 500 (^GSPC +0.11%) isn’t too far behind, either, with a pullback of 8.74%.
While pullbacks and stock market corrections are par for the course when putting your money to work in the world’s greatest wealth-building machine, sometimes these downturns can turn into full-fledged crash events.

President Trump overseeing Operation Epic Fury. Image source: Official White House Photo by Daniel Torok.
With stock market volatility effectively coinciding with the start of the Iran war, the question has to be asked: Will a stock market crash take shape under President Donald Trump? Given the variables we’re witnessing, such as historic energy supply disruption, 86 years of history offer a big clue.
Is a stock market crash imminent under Donald Trump?
On Feb. 28, U.S. and Israeli forces commenced military operations against Iran. Shortly thereafter, Iran announced the virtual closure of the Strait of Hormuz to oil exports. Approximately 20 million barrels of petroleum liquids pass through the Strait of Hormuz daily, accounting for 20% of the world’s demand, per the Energy Information Administration.
As of this writing in the early morning hours of March 29, the Strait of Hormuz remains closed. As a result, we’ve witnessed the largest energy supply disruption in history unfold — and gas prices have soared in its wake.
Major geopolitical events almost always increase near-term uncertainty and put investors on edge. We’ve certainly witnessed this uncertainty play out on Wall Street in recent weeks. However, there’s been one scenario over the last roughly nine decades that’s sparked a higher probability of significant downside (or even a crash) than others.
Here’s a list of major geopolitical events since WWII.
Up a median of 5% six months later. All of them felt really bad at the time. pic.twitter.com/Jb3QXL0L05
— Ryan Detrick, CMT (@RyanDetrick) February 28, 2026
According to a data set posted to social media platform X (formerly Twitter) by Carson Group’s Chief Market Strategist, Ryan Detrick, there have been 43 major geopolitical and historical events since the start of 1940. Over 86 years, many of these events turned out to be much ado about nothing. One year after the beginning of 40 of these events, the benchmark S&P 500 was higher 65% of the time.
The one exception has been oil price shock events. Although not all geopolitical events that caused oil prices to skyrocket resulted in significant downside for the S&P 500 or a stock market crash, instances of elevator-down moves often coincided with oil price shocks.
For instance, the S&P 500 tumbled 45% in less than a year following the start of the five-month oil embargo by OPEC’s Arab nations in October 1973, and it plunged by double digits three weeks after Iraq invaded Kuwait in August 1990.
Things are especially precarious for the stock market at present. In addition to entering 2026 at its second-priciest valuation in 155 years, according to the Shiller Price-to-Earnings Ratio, investor optimism has been fueled by the prospect of future rate cuts by the Federal Reserve. With inflation forecasts worsening as a direct result of the aforementioned historic energy supply disruption, it’s becoming likelier that the nation’s central bank will raise, not lower, interest rates.
While history can’t concretely predict short-term directional moves in the Dow Jones Industrial Average, S&P 500, or Nasdaq Composite, the necessary puzzle pieces for a stock market crash under President Trump appear to be in place.

Image source: Getty Images.
Historic events often beget opportunity for long-term-minded investors
It’s certainly within the realm of possibilities that things get worse for stocks before they get better. But it’s important to note that major geopolitical and historical events have typically paved the way for long-term-minded investors to profit.
As noted, pullbacks, stock market corrections, bear markets, and crashes are normal and inevitable events. No amount of fiscal or monetary policy maneuvering, nor well-wishing by investors, can keep stocks from the occasional event- or emotion-driven swoon.
But the common theme among Wall Street downturns is that they resolve quickly.
In February, analysts at Bespoke Investment Group published a data set to X that compared the length of every S&P 500 bull and bear market dating back to the start of the Great Depression (September 1929). Over the last 96 years, there have been 27 instances in which the S&P 500 lost at least 20%, and 27 where it climbed by at least 20%.
The current bull market — the “AI Bull” — has eclipsed the 1,200-day mark. This is the 10th bull market to last 1,000+ days based on the 20% rally/decline threshold.
Bear markets, on average, are much shorter, at just 286 days, with the longest being 630 days back in… pic.twitter.com/ds7lqWWHFh
— Bespoke (@bespokeinvest) February 10, 2026
On the one hand, the average S&P 500 bear market has lasted just 286 calendar days (less than 10 months) since September 1929, with none surpassing 630 calendar days.
At the other end of the spectrum, the typical S&P 500 bull market stuck around for 1,011 calendar days (about two years and nine months). Furthermore, 10 of 27 bull markets have lasted at least 1,200 calendar days, including the current bull market.
Statistically, being a long-term optimist gives investors the highest probability of success. If this historic energy supply disruption incites a stock market crash under Trump, opportunistic long-term investors shouldn’t be afraid to pounce.


![i’m-nervous,-too!-[part-2]](https://10xwealthreport.com/wp-content/uploads/2026/03/177042-im-nervous-too-part-2-1568x784.jpg)