Key Points
-
Although the Dow Jones Industrial Average, S&P 500, and Nasdaq Composite have outperformed under President Trump, headwinds are also mounting for the stock market.
-
The inflationary effects of the Iran war may force the Federal Open Market Committee (FOMC) into action.
-
A monetary policy shift by America’s foremost financial institution may prove devastating for a historically pricey stock market.
Statistically, the stock market tends to rise under most presidents. Dating back to the late 1890s, 26 of the last 33 terms have featured gains in the iconic Dow Jones Industrial Average (DJINDICES: ^DJI) or benchmark S&P 500 (SNPINDEX: ^GSPC).
But under Donald Trump, annualized gains in the Dow, S&P 500, and tech-driven Nasdaq Composite (NASDAQINDEX: ^IXIC) have been among the best of any president. During President Trump’s first, non-consecutive term, the Dow, S&P 500, and Nasdaq gained 57%, 70%, and 142%, respectively.
Will AI create the world’s first trillionaire? Our team just released a report on the one little-known company, called an “Indispensable Monopoly” providing the critical technology Nvidia and Intel both need. Continue »
While an assortment of catalysts has fueled the current bull market rally, including the evolution of artificial intelligence (AI), record S&P 500 share buybacks, and a Federal Reserve rate-easing cycle that began in September 2024, headwinds are also mounting.

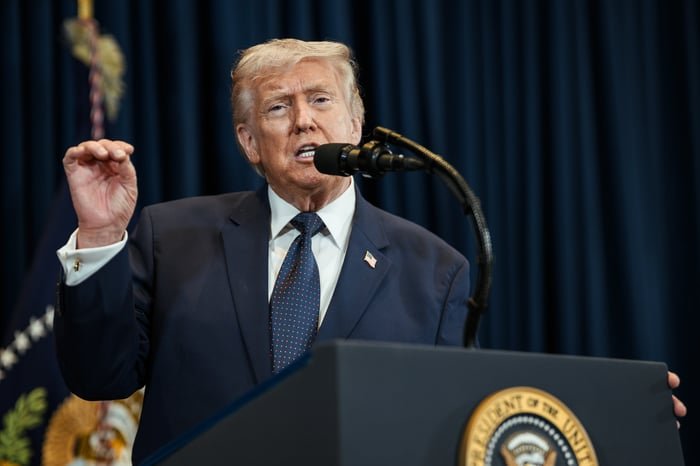
Donald Trump delivering a speech from behind the presidential podium.
President Trump delivering remarks at a press conference. Image source: Official White House Photo by Daniel Torok.
Although no short-term directional moves in Wall Street’s major stock indexes can ever be predicted with concrete accuracy, the probability of a stock market crash under Donald Trump is climbing — and the blame may lie with the president.
The Iran war can shift the Federal Reserve’s and Wall Street’s narrative
At any given time, one or more catalysts are threatening to upend the stock market. Right now, none stands out more than the Iran war.
On Feb. 28, at Trump’s command, U.S. military forces, along with Israel, commenced attacks against Iran. Shortly after these operations began, Iran closed the Strait of Hormuz to virtually all oil exports. Even though a ceasefire has been brokered between the U.S. and Iran, as of this writing on April 11, shipping traffic through the Strait of Hormuz hasn’t returned to normal.
According to the Energy Information Administration, approximately 20 million barrels of liquid petroleum, representing 20% of global demand, pass through the Strait of Hormuz daily. In other words, Trump’s actions have led to the largest energy supply disruption in modern history.
The law of supply and demand is straightforward: when the demand for a good or service outstrips its supply, prices should rise until demand tapers off. Since late February, crude oil prices have skyrocketed, resulting in a significant increase in fuel prices for consumers and higher transportation/production costs for businesses.
Even if the Iran war ends relatively quick, the damage to the U.S. economy and stock market may already be done. In other words, we’re talking about a complete narrative shift for America’s foremost financial institution, the Federal Reserve, and Wall Street.

Jerome Powell answering questions following a Federal Open Market Committee meeting.
Fed Chair Jerome Powell delivering remarks. Image source: Official Federal Reserve Photo.
Donald Trump’s measures may force the Fed to act
Although the most direct impact of the Iran war is being seen in fuel prices, the bigger question is what this Trump-led conflict might mean for the U.S. inflation rate.
In February, the U.S. Bureau of Labor Statistics (BLS) reported trailing 12-month (TTM) U.S. inflation of 2.4%. Though this was the 59th consecutive month of TTM inflation topping the Fed’s long-term target of 2%, it’s been moving in the right direction since the summer of 2022.
On April 10, the March inflation report from the BLS showed a 90-basis-point jump in TTM inflation to 3.3%. While Fed Chair Jerome Powell has repeatedly pointed to the stickiness of Trump’s tariffs in the goods sector as a reason inflation has remained above 2%, the bulk of the March inflation increase derives from the Iran war.
According to the Federal Reserve Bank of Cleveland’s Inflation Nowcasting projections, things are going to get worse before they have any opportunity to get better. The Cleveland Fed’s tool estimates that TTM inflation will rise another 28 basis points in April to 3.58% (as of its April 10 estimate).
While core inflation, which excludes energy and food price changes, has been tamer, persistently high energy commodity prices may be impossible for the Federal Open Market Committee (FOMC) to sweep under the rug. The FOMC is the 12-person body, including Fed Chair Jerome Powell, responsible for adjusting the nation’s monetary policy.
Though the FOMC has been in a rate-easing cycle since September 2024, select voting members are leaving the door open to interest rate hikes. If the FOMC halts its easing cycle and shifts to rate increases, the probability of a stock market crash rises considerably.
A historically pricey stock market compounds an already precarious situation
However, the prospect of the FOMC raising interest rates is only part of the story.
Although businesses and investors typically prefer lower interest rates because they encourage corporate borrowing, what makes a rate-hiking scenario so dangerous is that the stock market entered 2026 at its second-priciest valuation in 155 years.
With the understanding that value is a subjective term that’s going to vary from one investor to the next, the S&P 500’s Shiller Price-to-Earnings Ratio, also referred to as the Cyclically Adjusted P/E Ratio (CAPE Ratio), does a phenomenal job of cutting through this subjectivity.
When back-tested to January 1871, the Shiller P/E has averaged 17.35. But for a majority of the last seven months, the Shiller P/E has been vacillating between 39 and 41. The months leading up to the bursting of the dot-com bubble are the only time the stock market has been more expensive than it is now.
Typically, an FOMC rate hike wouldn’t upend a bull market or threaten to cause a stock market crash. But with a CAPE Ratio of over 39, as of the closing bell on April 10, there’s simply no margin for error on Wall Street. Investors have been counting on future FOMC rate cuts to fuel aggressive spending on AI data centers and infrastructure. If the FOMC halts its rate-easing cycle or shifts it entirely, maintaining nosebleed valuation premiums may prove impossible.
While the puzzle is far from complete, the pieces for a stock market crash to take shape under Donald Trump are present.
Should you buy stock in S&P 500 Index right now?
Before you buy stock in S&P 500 Index, consider this:
The Motley Fool Stock Advisor analyst team just identified what they believe are the 10 best stocks for investors to buy now… and S&P 500 Index wasn’t one of them. The 10 stocks that made the cut could produce monster returns in the coming years.
Consider when Netflix made this list on December 17, 2004… if you invested $1,000 at the time of our recommendation, you’d have $581,304!* Or when Nvidia made this list on April 15, 2005… if you invested $1,000 at the time of our recommendation, you’d have $1,215,992!*
Now, it’s worth noting Stock Advisor’s total average return is 1,016% — a market-crushing outperformance compared to 197% for the S&P 500. Don’t miss the latest top 10 list, available with Stock Advisor, and join an investing community built by individual investors for individual investors.
*Stock Advisor returns as of April 18, 2026.
Sean Williams has no position in any of the stocks mentioned. The Motley Fool has no position in any of the stocks mentioned. The Motley Fool has a disclosure policy.