Apple (AAPL) is at a crossroads — technically and fundamentally.
The stock has three big things happening at once: a CEO change, earnings next week, and a breakout that’s already under pressure.
Since the broader market’s March 30 low, Apple stock is up 9% — now the worst performer in the “Magnificent Seven.” Monday’s breakout above the yellow downward-sloping trend line from Apple’s December all-time high briefly pushed the stock green on the year. Now that gain has all but evaporated.
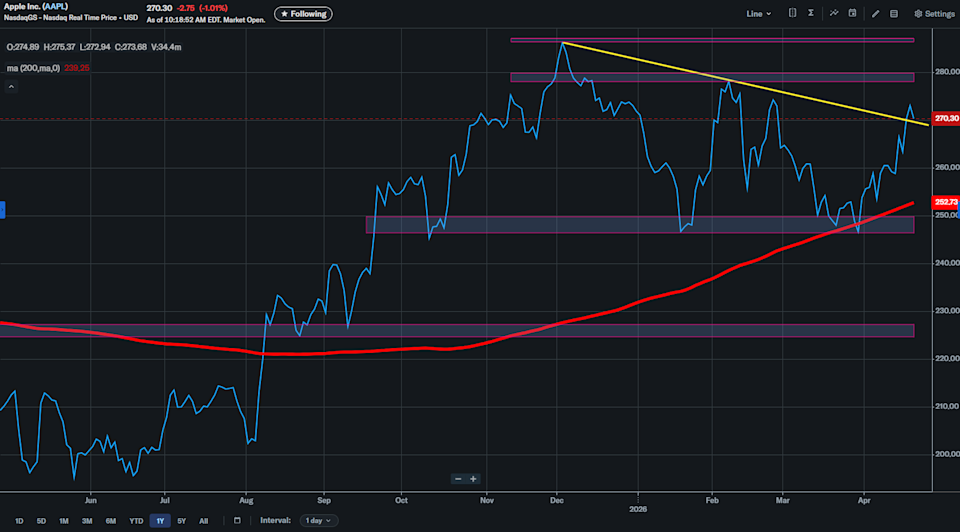
Apple 1-year stock chart.
Apple announced Monday that Tim Cook will step down on Sept. 1, with hardware chief John Ternus taking over. Earnings land on April 30 — Cook’s final report as sitting CEO. Given Tuesday’s selling — the stock is down more than 2% — the Cook news may be weighing on sentiment after all.
The immediate level in play is the five-day moving average (not shown) around $268. A close below that level would likely confirm Monday’s move as a false breakout — the kind of fast reversal that traps buyers who chased the break, especially on big news.
One structural positive remains. Unlike Meta (META) and Tesla (TSLA) — other Mag 7 names that are running into flat 200-day moving averages — Apple’s 200-day (orange) is clearly rising, a better safety net if this breakout fails.
The breakout came fast. Keeping it is already the harder part.
Levels to watch: On the one-year stock chart, $278 to $280 is the next big barrier, followed by the $286 to $289 all-time high zone. Below the five-day moving average at $268, the first major potential support area is $245 to $250. Below that, the $225 to $227 zone lines up with the rising 200-day.
Jared Blikre is the global markets and data editor for Yahoo Finance. Follow him on X at @SPYJared or email him at jaredblikre@yahooinc.com.
Click here for the latest stock market news and in-depth analysis, including events that move stocks
Read the latest financial and business news from Yahoo Finance