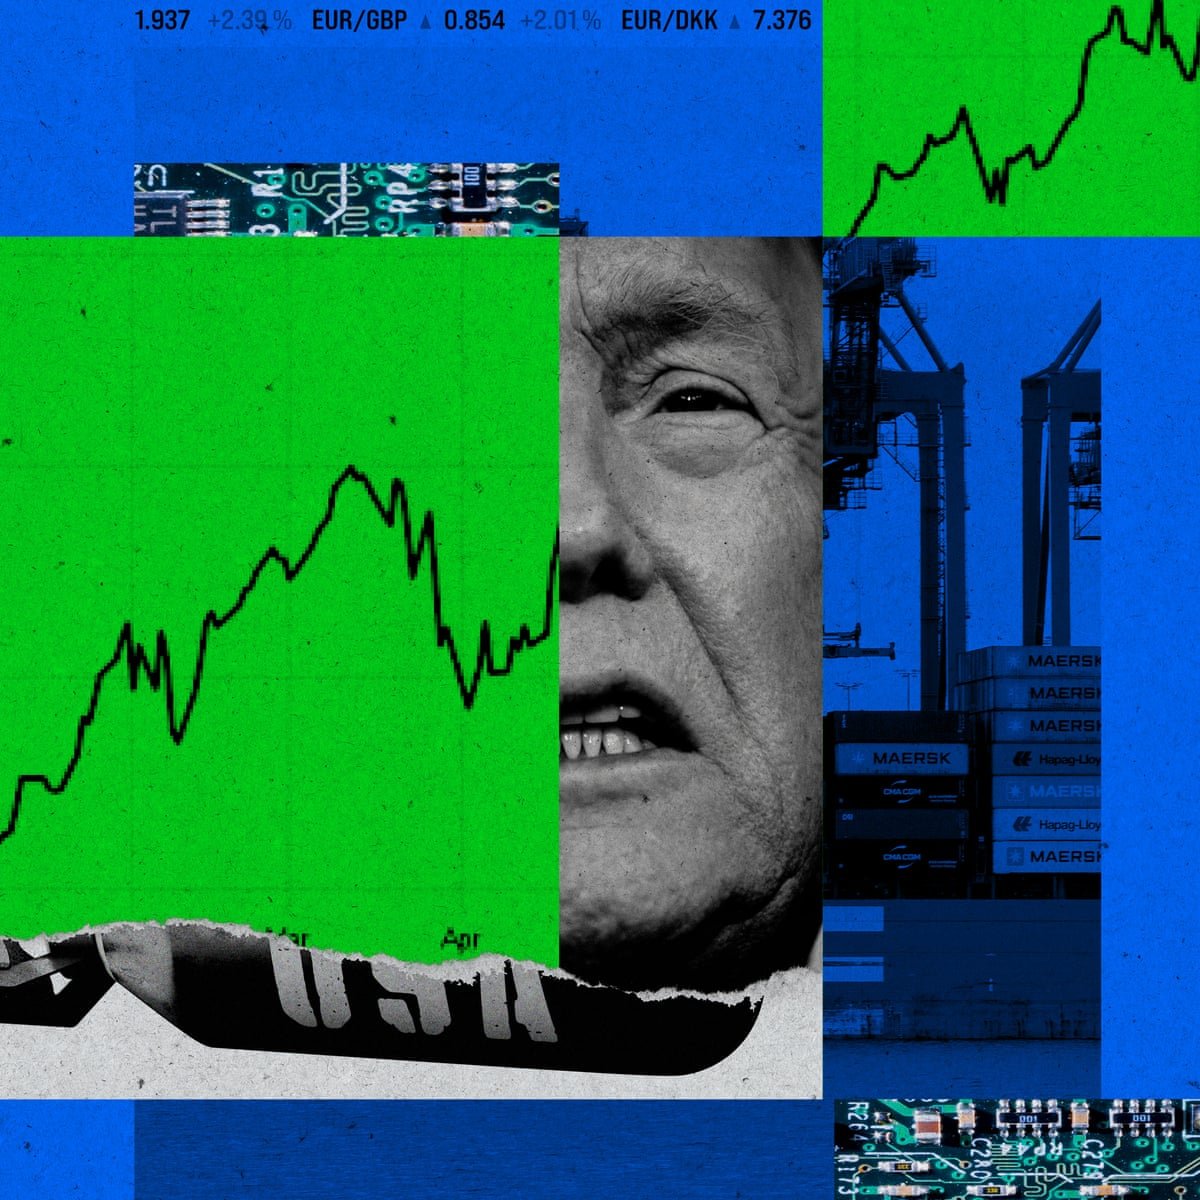
Stock markets have ignored inflation fears amid the AI buildout frenzy. Will retail sales data finally rouse them?
- US PPI data put wholesale inflation at 6% y/y in April, the highest since December 2022
- The energy price shock is now spilling into transportation, warehousing, and margins
- Can stock markets look the other way if April’s retail sales data shows consumers buckling?
US wholesale inflation surged in April to its highest level in over three years, dramatically overshooting expectations. The shock comes one day after a hotter-than-forecast consumer inflation print, and on the eve of an April retail sales report set to show whether US shoppers are still holding up. A narrow chip-stock melt-up continued on Wall Street, setting fresh record highs even as every other major markets priced in a worsening squeeze on the economy.
Wholesale inflation is no longer just an energy story
Headline producer price index (PPI) data showed wholesale inflation rose to 6% year-on-year in April, well above the 4.9% expected by economists and the highest reading since December 2022. The core measure stripping out food and energy rose also hit the highest in over three years, rising to 5.2% year-on-year and topping the 4.3% consensus.
On its surface, the headline number tells a familiar US-Iran war story. Crude oil moves filter into inflation gauges with a roughly one-month lag, and West Texas Intermediate (WTI) crude is still pinned near $101 a barrel, near the middle of its wartime range. Goods PPI was unsurprisingly driven by surging fuel costs from jet fuel to gasoline.
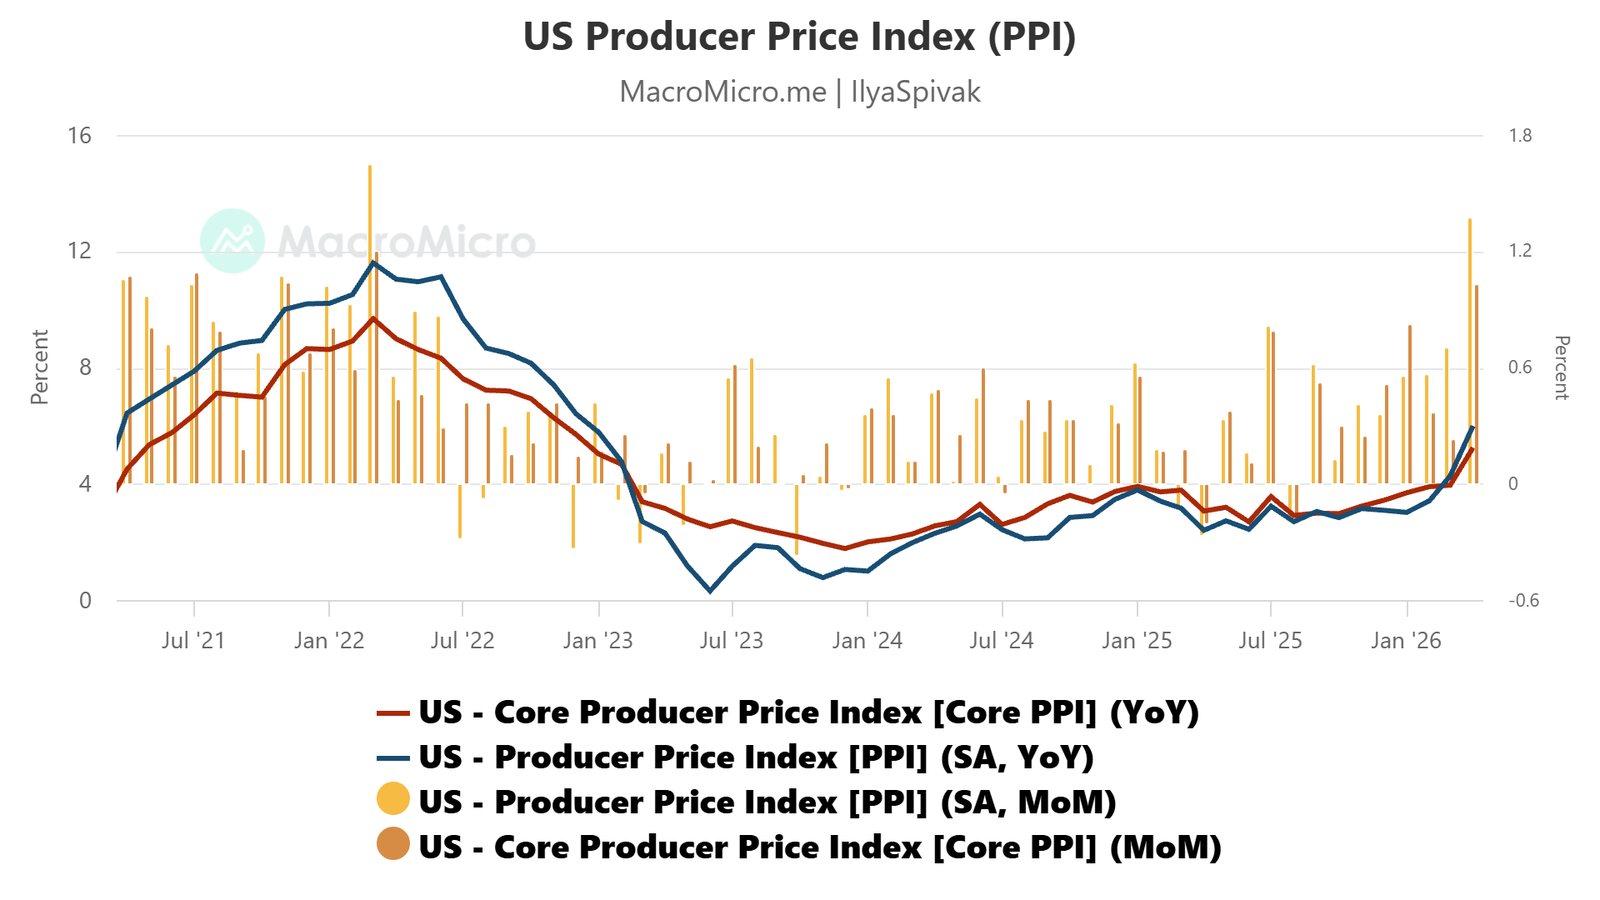
The worrying part is on the services side. The biggest jump was in transportation and warehousing services, up north of 12% year-on-year. That captures the cost of moving goods from where they arrive or are made to where they are sold — cost pressure much closer to the consumer than the wellhead.
Trade services, essentially wholesaler margins, also expanded sharply, with the bulk of the move tied to selling petroleum, fuels, and lubricants. In other words, the Iran war oil price shock is no longer just an energy line item. It is spilling into the costs of nearly everything energy touches.
The CPI picture confirms inflation spillover
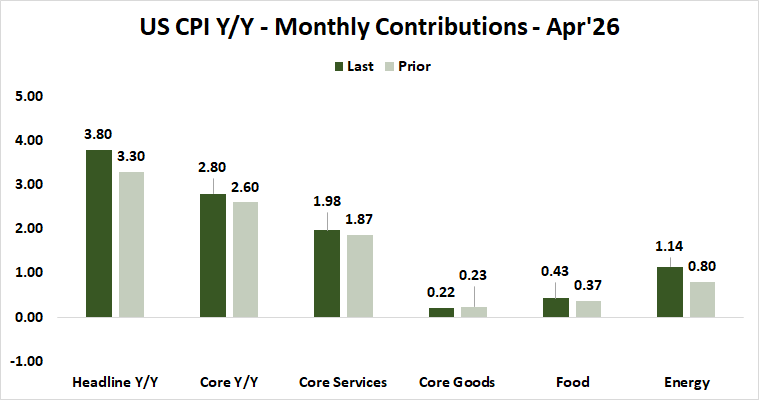
This follows April’s headline US consumer price index (CPI) reading at 3.8% year-on-year, which also overshot expectations at 3.7% and marked the highest reading since late 2023. Core CPI came in at 2.8%, beating consensus at 2.7%.
Energy was again the standout, but the worrying pattern is that service-sector costs outside food and energy grew faster too. Core services inflation is showing the same signs of spillover as PPI. Tellingly, the biggest uplift came from transportation.
Bond markets have been pricing in these risks for weeks. The spread between 5- and 10-year breakeven inflation rates was virtually nonexistent at the start of the year and has widened sharply, signaling traders are looking beyond the immediate spike in oil prices to inflation that stubbornly builds over a longer time horizon. With WTI still locked in its wartime range despite a supposed ceasefire, that impulse looks unlikely to fade soon.
Retail sales data will test the US consumer
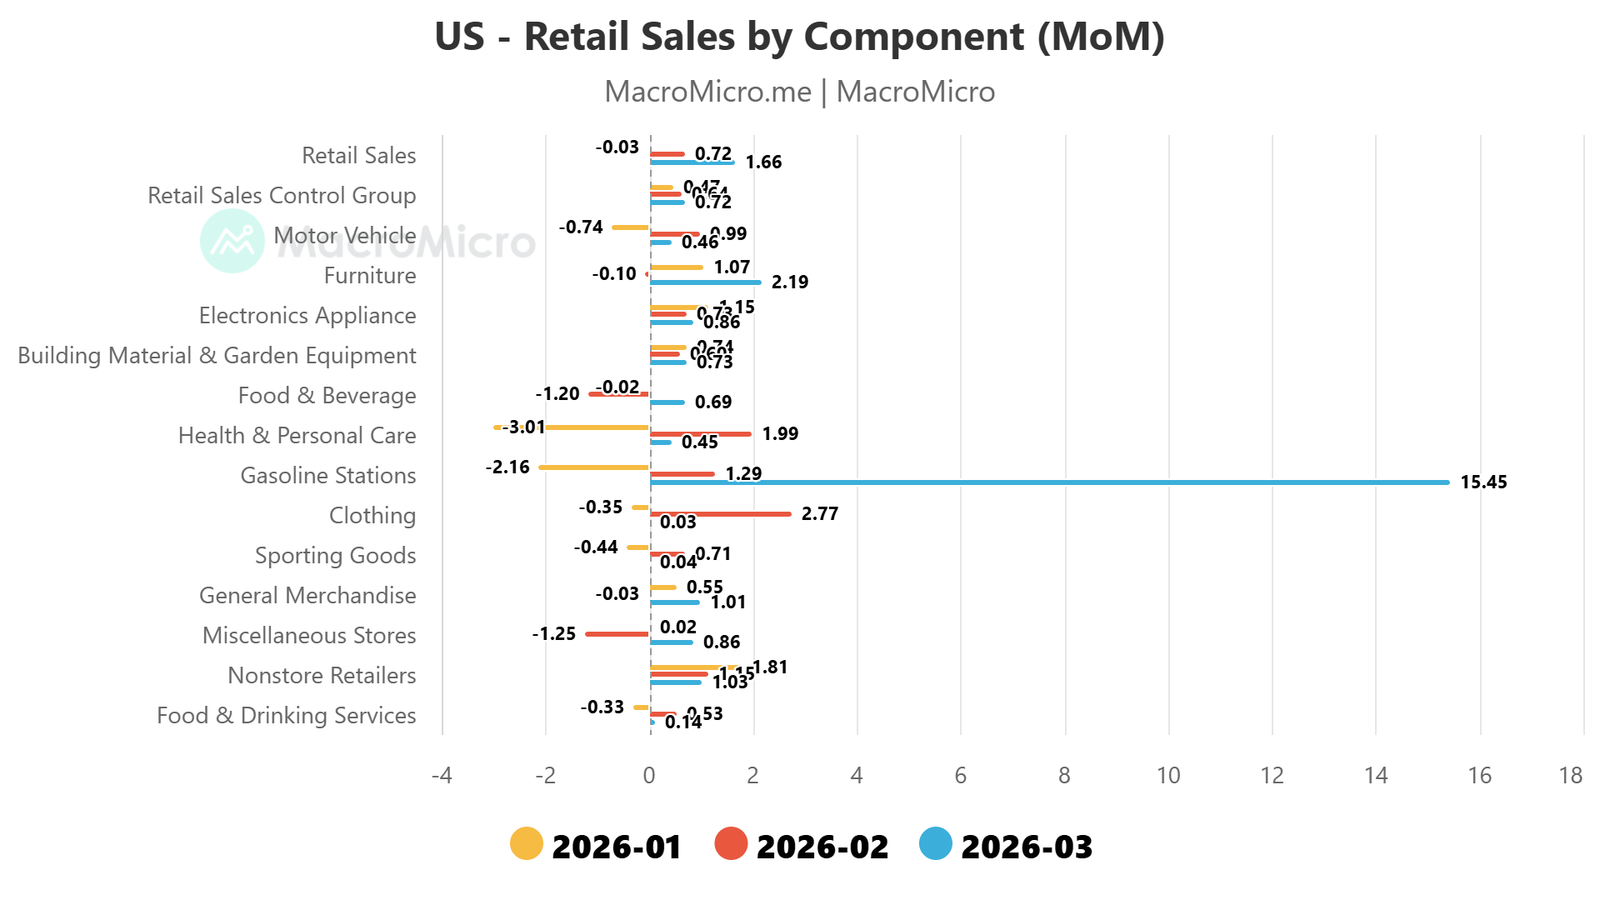
The April retail sales report is the next clean read on whether the consumer is bending under all of this pressure. The consensus calls for a modest 0.5% monthly rise after March’s much stronger 1.7% jump. That bounce was unhelpfully inflated by an almost 15.5% surge in gas station sales. This was a display of the oil price shock expressed in dollar terms rather than a genuine burst of demand strength.
The backdrop is unforgiving. First-quarter US gross domestic product (GDP) data showed consumption — a meaty 68% slice of total output — grew at meager annual rate of 1.6%, weaker than GDP itself at 2% and slowing for a second consecutive quarter.
Meanwhile, the Federal Reserve and other major central banks have abandoned any near-term hope of rate cuts. The US central bank looks the most dovish of the bunch and is priced for policy standstill this year. Before the war, traders were primed for 50 basis points (bps) of easing. The Bank of England (BOE) and the European Central Bank (ECB) are now slated for hikes, and the Reserve Bank of Australia (RBA) is penciled for four rate hikes instead of just two previously.
That means consumers are facing a sustained squeeze with no monetary policy relief in sight. Whatever growth shock arrives will be allowed to develop until it does enough damage to beat back prices and justify cuts. That looks like a high bar given how stuck the inflation picture looks.
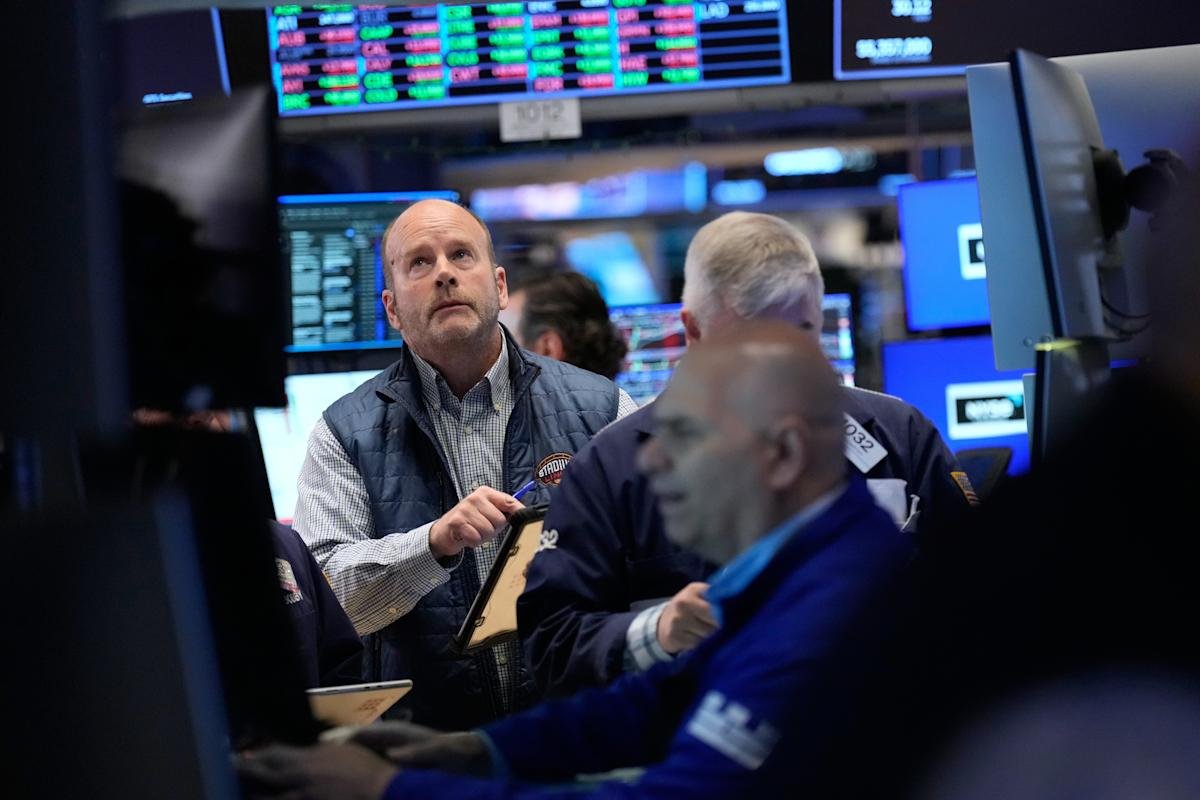
The chip-stock melt-up is asking a lot
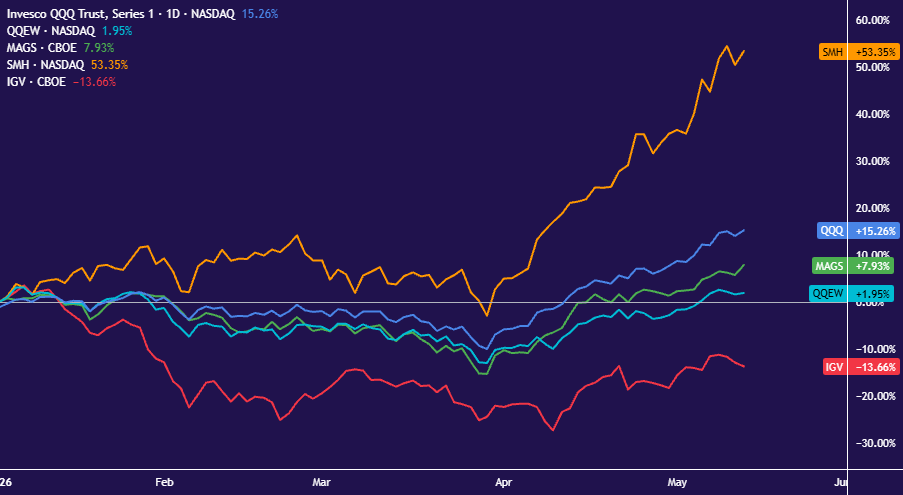
Stocks are still pushing higher into all of this. The bellwether S&P 500 set another record today, but the technical issues flagged two weeks ago persist. Trading volumes have shrunk throughout the rebound from the wartime selloff. The headline Nasdaq is up over 15% year-to-date, but the equal-weighted version is up just 2%. The magnificent seven mega-caps are up only 8%. Software companies exposed to artificial intelligence (AI) disruption are down close to 14%. The singular force lifting the indexes is semiconductors, up more than 53% year-to-date.
The fundamental case for that move rests on that same first-quarter GDP data showing fixed nonresidential investment contributing 1.39 percentage points (ppt) to the 2% growth headline, edging out consumption at 1.08ppt despite the latter being five times larger as a share of the economy. Business investment grew at a blistering annual rate of 10.4% however, outpacing consumption more than sixfold. Stock markets seem to be betting that this composition can persist — that the AI building frenzy can burn hot enough to offset retreating consumers.
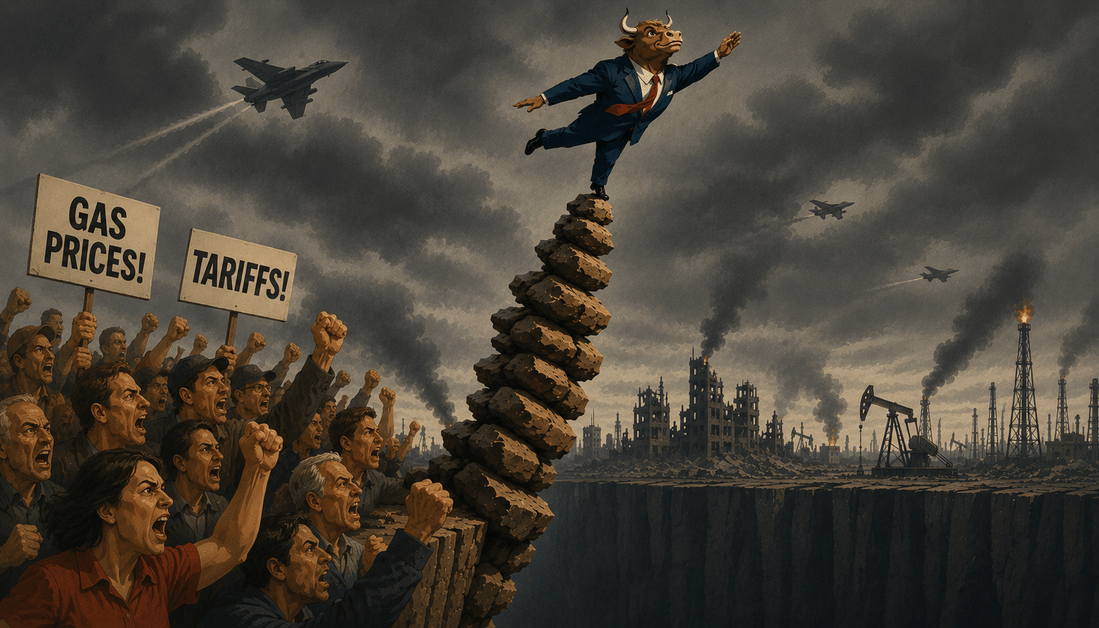
And yet, the same headwinds bedevil data center builders and consumers alike: higher oil prices, dramatically elevated transport costs, mounting bottlenecks for key inputs, and a murky outlook for economic policy. A gauge measuring that uncertainty based on analysis of the news articles is at the highest in about four decades.
Close to 40% of data center projects originally slated for 2026 have already been reported as delayed into 2027 and beyond. It will be devilishly hard for business investment’s 14% slice of GDP to keep outpacing consumption’s 68% – by far the lion’s share – if both are being hobbled simultaneously.
If April’s retail sales report suggests that consumers are buckling — especially if demand looks weak even after gas station sales are stripped out — stock markets may find the economic backdrop harder to ignore. The melt-up has been running on fading trading volumes for weeks. Thin liquidity makes prices easier to push around in either direction. If the data demands Wall Street to rethink its ways, the about-face that follows may be a violent affair.
Ilya Spivak, tastylive Head of Global Macro, has over 15 years of experience in trading strategy. He specializes in identifying thematic moves in currencies, commodities, interest rates and equities. He hosts Macro Money and co-hosts Overtime, Monday-Thursday. @Ilyaspivak
For live daily programming, market news and commentary, visit tastylive.com or @tastyliveshow on YouTube
Trade with a better broker, open a tastytrade account today. tastylive, Inc. and tastytrade, Inc. are separate but affiliated companies.
Options involve risk and are not suitable for all investors. Please read Characteristics and Risks of Standardized Options before deciding to invest in options.
© copyright 2013 – 2026 tastylive, Inc.