It’s been another record-breaking year for the stock market, with the S&P 500 (^GSPC +0.32%), Nasdaq Composite (^IXIC +0.66%), and Dow Jones Industrial Average (^DJI +0.30%) each soaring by more than 20% over the past 12 months, as of August 2026.
Much of the growth over the last few years has been fueled by artificial intelligence (AI) stocks. However, concerns over an AI bubble are building, with fund managers citing this as the most significant tail risk facing the market right now, according to Bank of America‘s latest Global Fund Manager Survey.
If an AI bubble is looming, the market’s heavy concentration in tech stocks could pose a serious risk for investors. Here’s what history suggests may be coming next.

Image source: Getty Images.
The market is sending a warning signal right now
Mega-cap tech stocks dominate the S&P 500, with the 10 largest companies accounting for around 40% of the index. The S&P 500 has not been that concentrated since 1965, according to data from S&P Global. Even at the peak of the dot-com bubble in March 2000, the index’s top 10 holdings were weighted at only around 26%.
So what does this mean for investors? In short, a handful of companies have a significant influence on the S&P 500’s performance. When those stocks are booming, it can result in above-average returns. But if they falter, it could drag down the entire market.
Even more concerning is the fact that most of the S&P 500’s largest companies are heavily invested in AI. The index’s top five holdings are Nvidia, Apple, Alphabet, Microsoft, and Amazon. All of these companies have taken big swings on AI, with Amazon alone spending nearly $100 billion on data centers in the first half of 2026.
Regardless of whether the AI build-out pays off, it’s a significant risk to have such a large portion of a major index like the S&P 500 concentrated in one sector — especially one as uncertain as AI.
Is an AI bubble burst coming in 2026?
It’s impossible to predict exactly how the market will fare in the short term, but history suggests a pullback could be coming.
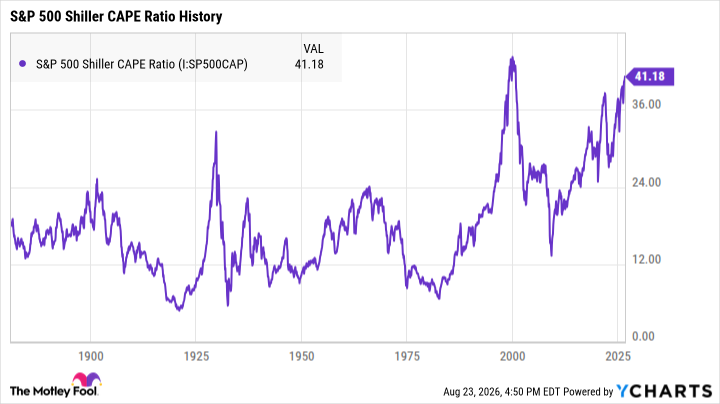
One valuation metric with decades of historical context is the S&P 500 Shiller Cyclically Adjusted Price-to-Earnings (CAPE) ratio. This metric compares the S&P 500’s price to its 10-year inflation-adjusted earnings, and higher figures suggest that the index is more richly valued. Generally, stock prices also tend to fall in the years following peaks.
Dating back to the 1870s, this ratio has averaged around 17. It surpassed 30 during the lead-up to the Great Depression, and it hit an all-time high of 44 immediately before the dot-com bubble burst. As of this writing, it sits at over 41.
S&P 500 Shiller CAPE Ratio data by YCharts
The CAPE ratio has consistently held above 40 since May of this year, which is only the second time in history it’s stayed this high. The metric first surpassed 40 in January 1999, and it continued to climb until the dot-com bubble officially popped in March 2000.
Again, this doesn’t necessarily mean a future bear market will follow the same pattern. But recessions are a normal part of the market’s cycle, so it’s only a matter of time before we face some type of downturn. The CAPE ratio can’t predict the future, but it does suggest that many stocks may be overvalued.
What should investors do right now?
History does have good news for investors: Over time, healthy stocks are overwhelmingly likely to thrive. Since the beginning of the dot-com bear market in March 2000, the S&P 500 has earned total returns of more than 700% — and many individual companies have fared even better.
The best move investors can make right now is to focus on buying quality stocks from healthy companies. If an AI bubble burst is on the horizon, some overvalued tech stocks may struggle to survive. But those from businesses with strong fundamentals and a robust competitive advantage are the most likely to succeed over time.