The past few years have seen strong returns from the S&P 500 index (^GSPC +0.00%), but one of the most important valuation metrics is flashing a big warning sign. The Shiller CAPE Ratio was developed to measure cyclically adjusted price-to-earnings (“CAPE”) for the 500 largest publicly traded stocks in the U.S. market. Instead of standard P/E ratios, the CAPE ratio intends to create a consistent measurement of S&P 500 stock valuations across different timeframes and economic conditions — including recessions.
No single metric is always 100% correct at predicting the future of the stock market. But the Shiller CAPE Ratio is raising some eyebrows among investors and analysts. As of September 19, the CAPE Ratio is at its highest level since the dot-com bubble. Prior to that, the highest level the CAPE ratio had ever reached was in 1929 — in the last months before the “Roaring 20s” stock market boom turned into the Great Depression.
What should you do with your investments when the Shiller CAPE Ratio is “too high?” Well…most of the time, you might want to just stay put and keep investing. But if you’re worried about the valuation of large-cap stocks in the S&P 500, and you want to make a change in how you invest, small-cap stocks could be worth considering.
Let’s look at what the Shiller CAPE Ratio means for your investments, and why this historic warning signal doesn’t have to bring bad news for your financial future.

Image source: Getty Images.
Past performance (of the CAPE Ratio) doesn’t guarantee future results
The Shiller CAPE Ratio is widely respected as a valuation metric, and it’s worth paying attention to. But it’s also possible that this metric doesn’t mean what it used to mean. Ever since the dot-com bust, the S&P 500 has mostly been trading at levels far above the CAPE Ratio’s long-term average.
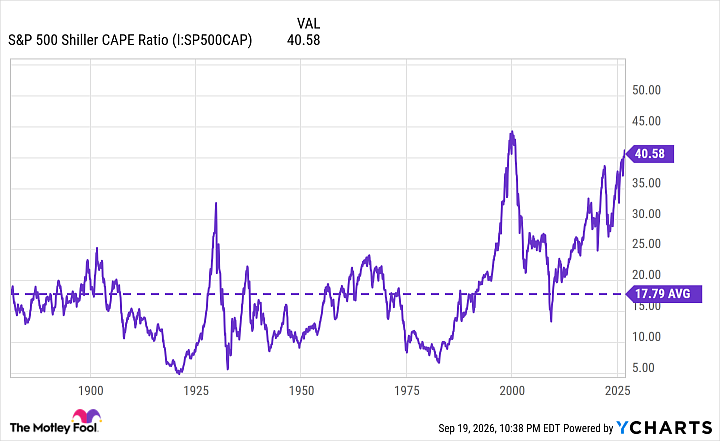
S&P 500 Shiller CAPE Ratio data by YCharts
The CAPE Ratio is not a law of nature, it’s one number. There’s a small sample size of previous historical moments when the CAPE Ratio got “too high.” It’s possible that S&P 500 companies today deserve to be valued more highly than they were in the 1950s-1970s. We might be in a “new normal” where the CAPE Ratio can stay higher for longer, without being a sure sign of a stock market crash.
The S&P 500 (mostly) grows in the long run
Even if the Shiller CAPE Ratio is spot-on in predicting the next stock market crash…well, that’s OK too. Long-term investors who can buy and hold shares in the S&P 500 tend to turn out just fine, even with big bear markets along the way. For the past 98 years, the S&P 500 has delivered average annual returns of about 10%, even with decade-long catastrophes like the Great Depression and short-term shocks and bear markets like the 2020 pandemic.
There’s almost never a bad time to buy the Vanguard S&P 500 ETF. Even if you buy an S&P 500 ETF just before a stock market crash, you’re likely to earn a strong return over the next 5-10 years or longer.

Today’s Change
Current Price
Worried about large-cap valuations? Consider small-caps
News headlines about metrics and valuation ratios are usually not a good reason to make big changes in your portfolio. But if you’re losing sleep at night about the risks of an artificial intelligence (AI) bubble, or if you feel like you want to diversify away from the large-cap stocks of the S&P 500, here’s a small-cap ETF you might want to consider.
The iShares Russell 2000 ETF holds 1,957 small-cap stocks. It has delivered annualized returns of about 10.5% for the past 10 years and has outperformed the S&P 500 in the past year.

Today’s Change
Current Price
Vanguard research forecasts that U.S. small-cap stocks will outperform U.S. large-cap and growth stocks in the next 10 years. If you’re worried about the CAPE Ratio, this could be a sign that small-caps are a better buy than the S&P 500 — or at least are worth including your portfolio.