Sam Daodu
5 min read
Quick Read
-
Bitcoin surged 36% while SPY flatlined and gold dropped 1.4%, yet the 90-day correlation still ties BTC to gold at a six-year high.
-
Two of Bitcoin’s three rally drivers reverse quickly. Treasury buybacks and short squeezes fall into this category, making sustained spot ETF inflows the only durable demand signal.
-
Five-year yields approaching 5%, a 17-year high, challenge Bitcoin’s rally; holding above $80,875 as yields rise would signal a genuine correlation break.
-
Read More: Learn 7 secret wealth tips high net worth investors use that most investors miss (sponsor)
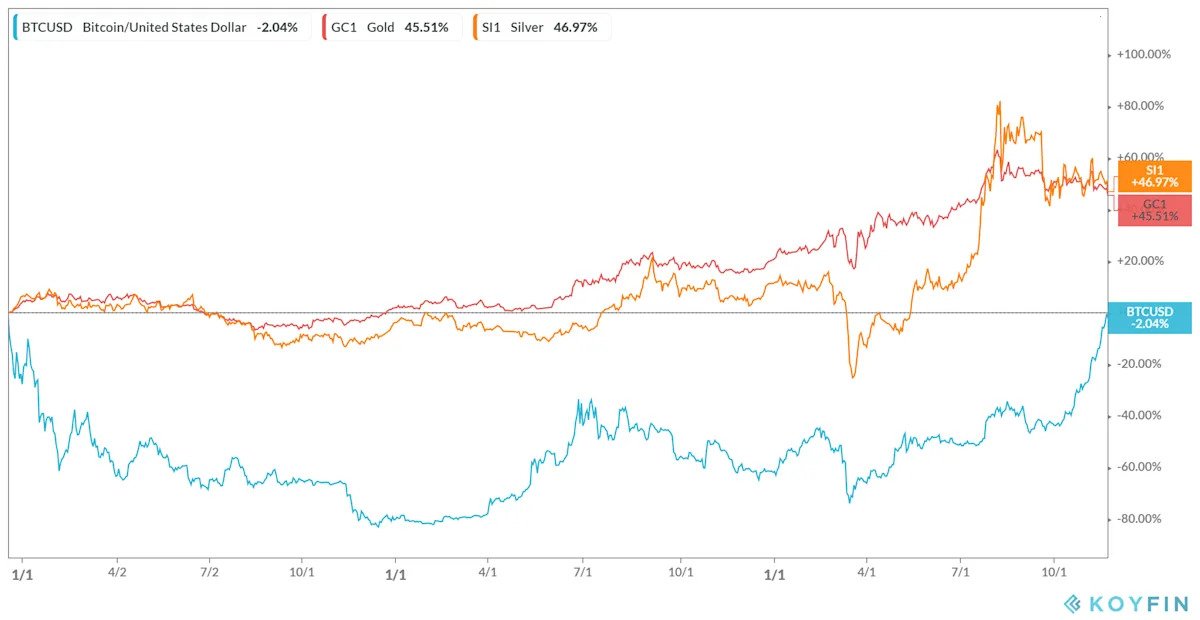
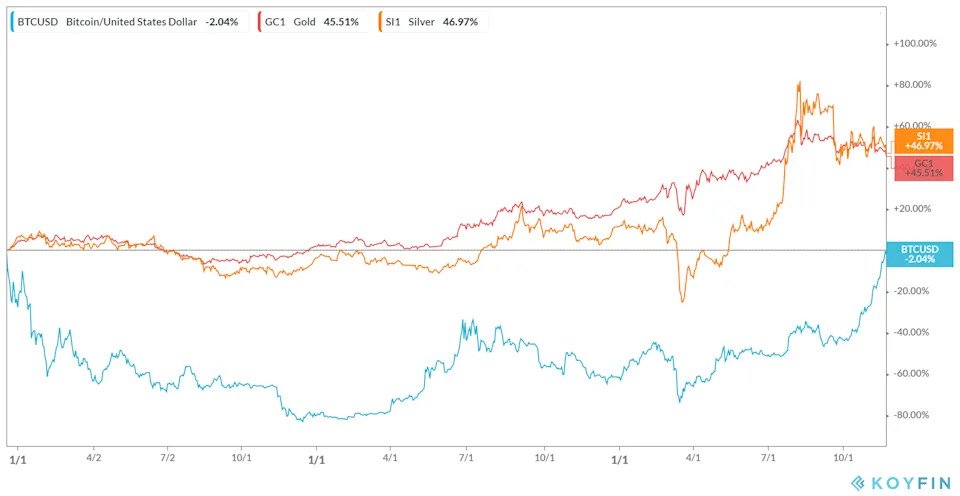
Bitcoin (CRYPTO: BTC) has surged by 36% since August 18, 2026, while the two assets it typically moves in sync with have shown little movement. Over the same period, the SPDR S&P 500 ETF Trust (NYSEARCA: SPY) returned only 0.05%, and SPDR Gold Shares (NYSEARCA: GLD) dropped 1.4%. This significant gap has led to renewed discussions about whether the established correlation between Bitcoin, stocks, and gold is coming to an end.
Now priced near $84,000, Bitcoin’s remarkable rise raises the question: Can five weeks of divergence be enough to declare the long-standing relationship with these assets over, or is this a short-term anomaly that might revert to the historical trend?
A Five-Week Window and a 90-Day Window Can Disagree, and They Do

Correlation is a statistic ranging from minus one to plus one, which describes how two assets have moved in relation to each other over a specific period. A score of plus one means they move together perfectly, zero indicates no relationship, and minus one shows they move in opposite directions. Since correlation can vary across time frames, a five-week correlation reading may differ from a 90-day reading, and both can be valid.
Currently, Bitcoin’s performance over the five weeks leading to September 23 shows a rise against a flat stock market and a declining gold price—this occurs in a calm context, with the VIX index, which measures expected stock market volatility, closing at 14.21, below the 15 mark that typically indicates stability.
——
Learn 7 Secret Wealth Tips High Net Worth Investors Use
How do you continue to grow a seven-figure portfolio in retirement? The last thing you want is to run out of money, you want your money to generate lasting income while you enjoy your life.
Learn seven strategies high net worth investors use with new report: The Seven Secrets of High Net Worth Investors from Fisher Investments. Get your guide here (sponsor)
——
However, the 90-day correlation shows Bitcoin at a six-year high with gold as of mid-September. Both views have their merits, but the longer 90-day trend presents a stronger case against the shorter five-week divergence.