NYSE – Nasdaq Real Time Price • USD
At close: September 13 at 4:00 PM EDT
Pre-Market: 4:01 AM EDT
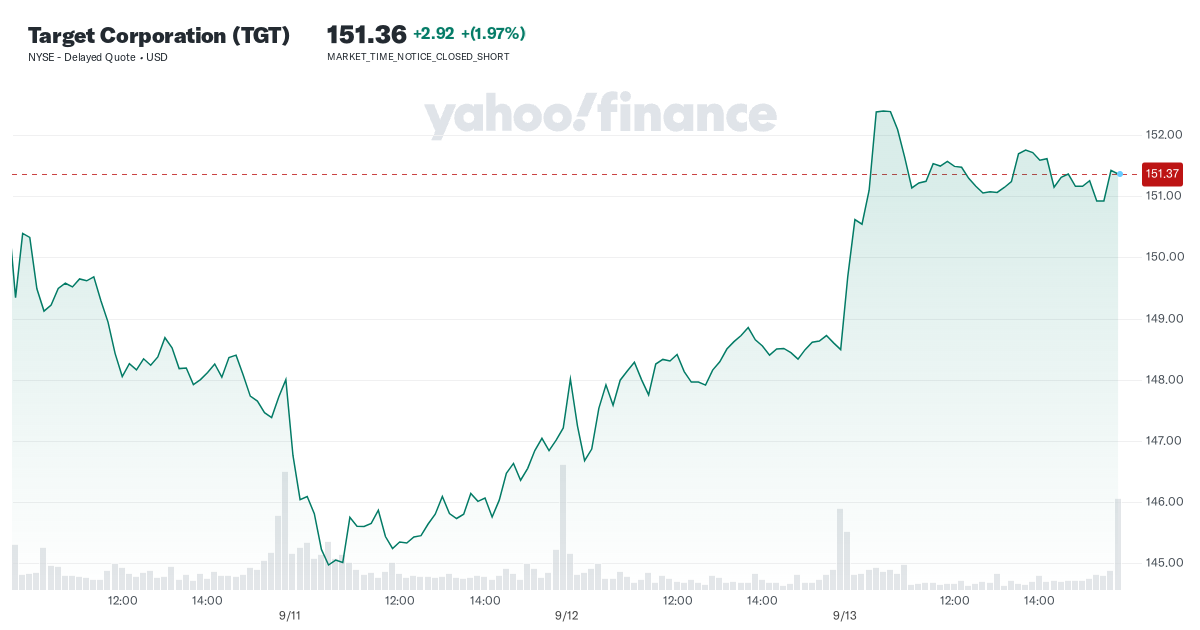
- Previous Close
148.44 - Open
149.72 - Bid —
- Ask —
- Day’s Range
149.48 – 152.62 - 52 Week Range
102.93 – 181.86 - Volume
2,076,785 - Avg. Volume
4,270,379 - Market Cap (intraday)
69.728B - Beta (5Y Monthly) 1.24
- PE Ratio (TTM)
15.62 - EPS (TTM)
9.69 - Earnings Date Nov 13, 2024 – Nov 18, 2024
- Forward Dividend & Yield 4.48 (2.96%)
- Ex-Dividend Date Aug 21, 2024
- 1y Target Est
177.99
Target Corporation operates as a general merchandise retailer in the United States. The company offers apparel for women, men, boys, girls, toddlers, and infants and newborns, as well as jewelry, accessories, and shoes; and beauty and personal care, baby gear, cleaning, paper products, and pet supplies. It also provides dry grocery, dairy, frozen food, beverages, candy, snacks, deli, bakery, meat, and food service; electronics, which includes video game hardware and software, toys, entertainment, sporting goods, and luggage; and furniture, lighting, storage, kitchenware, small appliances, home decor, bed and bath, home improvement, school/office supplies, greeting cards and party supplies, and other seasonal merchandise. In addition, the company sells merchandise through periodic design and creative partnerships, and shop-in-shop experience; and in-store amenities. Further, it sells its products through its stores; and digital channels, including Target.com. Target Corporation was incorporated in 1902 and is headquartered in Minneapolis, Minnesota.
415,000
Full Time Employees
February 03
Fiscal Year Ends
Trailing total returns as of 9/13/2024, which may include dividends or other distributions. Benchmark is .
YTD Return
1-Year Return
3-Year Return
5-Year Return
Select to analyze similar companies using key performance metrics; select up to 4 stocks.
Valuation Measures
As of 9/13/2024
-
Market Cap
69.73B
-
Enterprise Value
84.97B
-
Trailing P/E
15.64
-
Forward P/E
16.34
-
PEG Ratio (5yr expected)
2.00
-
Price/Sales (ttm)
0.65
-
Price/Book (mrq)
4.83
-
Enterprise Value/Revenue
0.79
-
Enterprise Value/EBITDA
9.31
Financial Highlights
Profitability and Income Statement
-
Profit Margin
4.18%
-
Return on Assets (ttm)
7.23%
-
Return on Equity (ttm)
33.97%
-
Revenue (ttm)
107.3B
-
Net Income Avi to Common (ttm)
4.49B
-
Diluted EPS (ttm)
9.69
Balance Sheet and Cash Flow
-
Total Cash (mrq)
3.5B
-
Total Debt/Equity (mrq)
132.80%
-
Levered Free Cash Flow (ttm)
3.74B