NasdaqGS – Nasdaq Real Time Price • USD
At close: September 13 at 4:00 PM EDT
Pre-Market: 4:20 AM EDT
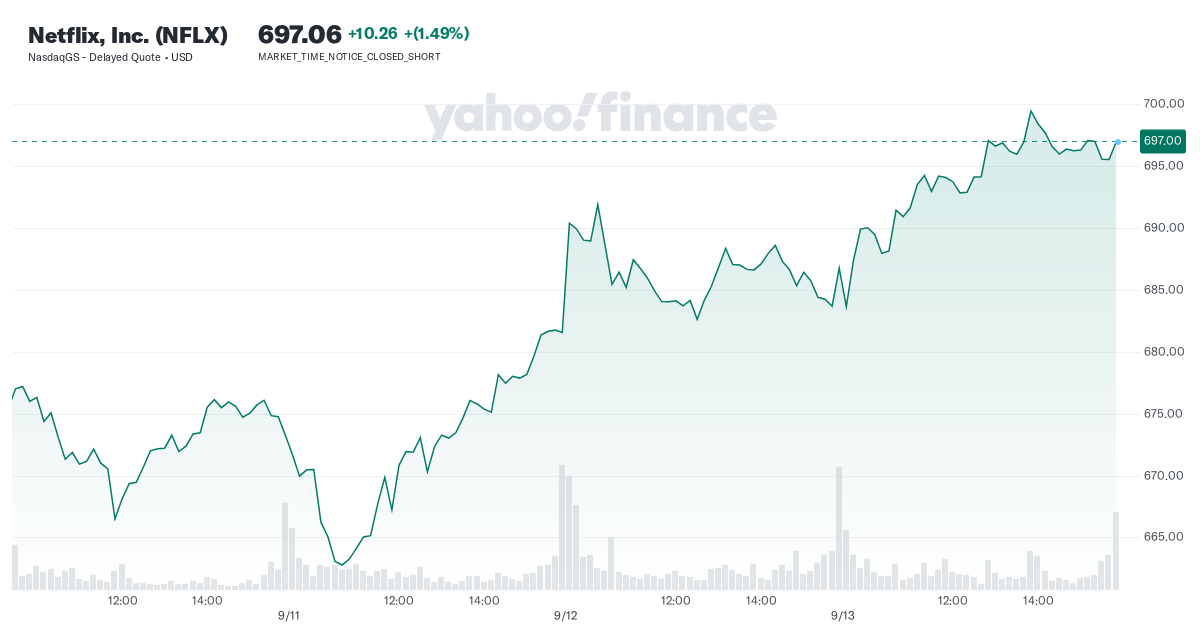
- Previous Close
686.80 - Open
680.01 - Bid 696.56 x 100
- Ask 697.62 x 200
- Day’s Range
680.00 – 699.59 - 52 Week Range
344.73 – 711.33 - Volume
2,276,482 - Avg. Volume
3,213,998 - Market Cap (intraday)
299.154B - Beta (5Y Monthly) 1.26
- PE Ratio (TTM)
43.48 - EPS (TTM)
16.03 - Earnings Date Oct 17, 2024
- Forward Dividend & Yield —
- Ex-Dividend Date —
- 1y Target Est
694.92
Netflix, Inc. provides entertainment services. It offers TV series, documentaries, feature films, and games across various genres and languages. The company also provides members the ability to receive streaming content through a host of internet-connected devices, including TVs, digital video players, TV set-top boxes, and mobile devices. It has operations in approximately 190 countries. The company was incorporated in 1997 and is headquartered in Los Gatos, California.
13,000
Full Time Employees
December 31
Fiscal Year Ends
Trailing total returns as of 9/13/2024, which may include dividends or other distributions. Benchmark is .
YTD Return
1-Year Return
3-Year Return
5-Year Return
Select to analyze similar companies using key performance metrics; select up to 4 stocks.
Valuation Measures
As of 9/13/2024
-
Market Cap
299.15B
-
Enterprise Value
306.48B
-
Trailing P/E
43.54
-
Forward P/E
31.15
-
PEG Ratio (5yr expected)
1.45
-
Price/Sales (ttm)
8.52
-
Price/Book (mrq)
13.53
-
Enterprise Value/Revenue
8.44
-
Enterprise Value/EBITDA
12.77
Financial Highlights
Profitability and Income Statement
-
Profit Margin
19.54%
-
Return on Assets (ttm)
10.82%
-
Return on Equity (ttm)
31.57%
-
Revenue (ttm)
36.3B
-
Net Income Avi to Common (ttm)
7.09B
-
Diluted EPS (ttm)
16.03
Balance Sheet and Cash Flow
-
Total Cash (mrq)
6.66B
-
Total Debt/Equity (mrq)
74.73%
-
Levered Free Cash Flow (ttm)
20.05B