
With its stock down 17% over the past three months, it is easy to disregard Best Buy (NYSE:BBY). However, a closer look at its sound financials might cause you to think again. Given that fundamentals usually drive long-term market outcomes, the company is worth looking at. Specifically, we decided to study Best Buy’s ROE in this article.
Return on Equity or ROE is a test of how effectively a company is growing its value and managing investors’ money. In other words, it is a profitability ratio which measures the rate of return on the capital provided by the company’s shareholders.
See our latest analysis for Best Buy
How Is ROE Calculated?
The formula for return on equity is:
Return on Equity = Net Profit (from continuing operations) ÷ Shareholders’ Equity
So, based on the above formula, the ROE for Best Buy is:
46% = US$1.3b ÷ US$2.8b (Based on the trailing twelve months to July 2023).
The ‘return’ is the yearly profit. So, this means that for every $1 of its shareholder’s investments, the company generates a profit of $0.46.
What Is The Relationship Between ROE And Earnings Growth?
So far, we’ve learned that ROE is a measure of a company’s profitability. Depending on how much of these profits the company reinvests or “retains”, and how effectively it does so, we are then able to assess a company’s earnings growth potential. Generally speaking, other things being equal, firms with a high return on equity and profit retention, have a higher growth rate than firms that don’t share these attributes.
Best Buy’s Earnings Growth And 46% ROE
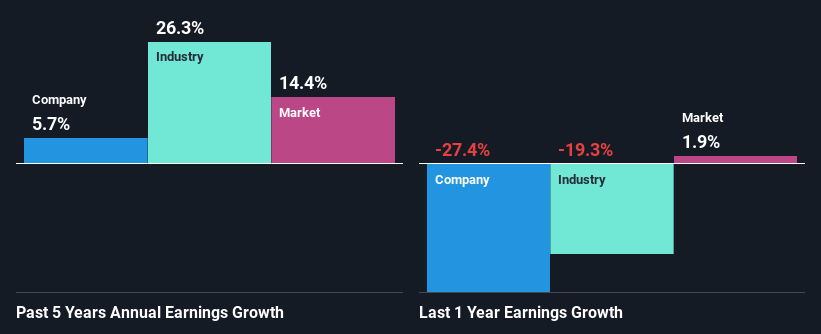
First thing first, we like that Best Buy has an impressive ROE. Secondly, even when compared to the industry average of 19% the company’s ROE is quite impressive. This probably laid the groundwork for Best Buy’s moderate 5.7% net income growth seen over the past five years.
As a next step, we compared Best Buy’s net income growth with the industry and were disappointed to see that the company’s growth is lower than the industry average growth of 26% in the same period.
Earnings growth is a huge factor in stock valuation. It’s important for an investor to know whether the market has priced in the company’s expected earnings growth (or decline). Doing so will help them establish if the stock’s future looks promising or ominous. What is BBY worth today? The intrinsic value infographic in our free research report helps visualize whether BBY is currently mispriced by the market.
Is Best Buy Using Its Retained Earnings Effectively?
Best Buy has a healthy combination of a moderate three-year median payout ratio of 34% (or a retention ratio of 66%) and a respectable amount of growth in earnings as we saw above, meaning that the company has been making efficient use of its profits.
Additionally, Best Buy has paid dividends over a period of at least ten years which means that the company is pretty serious about sharing its profits with shareholders. Our latest analyst data shows that the future payout ratio of the company is expected to rise to 50% over the next three years. Regardless, the future ROE for Best Buy is speculated to rise to 56% despite the anticipated increase in the payout ratio. There could probably be other factors that could be driving the future growth in the ROE.
Conclusion
In total, we are pretty happy with Best Buy’s performance. In particular, it’s great to see that the company is investing heavily into its business and along with a high rate of return, that has resulted in a respectable growth in its earnings. With that said, the latest industry analyst forecasts reveal that the company’s earnings growth is expected to slow down. To know more about the company’s future earnings growth forecasts take a look at this free report on analyst forecasts for the company to find out more.
Valuation is complex, but we’re helping make it simple.
Find out whether Best Buy is potentially over or undervalued by checking out our comprehensive analysis, which includes fair value estimates, risks and warnings, dividends, insider transactions and financial health.
Have feedback on this article? Concerned about the content? Get in touch with us directly. Alternatively, email editorial-team (at) simplywallst.com.
This article by Simply Wall St is general in nature. We provide commentary based on historical data and analyst forecasts only using an unbiased methodology and our articles are not intended to be financial advice. It does not constitute a recommendation to buy or sell any stock, and does not take account of your objectives, or your financial situation. We aim to bring you long-term focused analysis driven by fundamental data. Note that our analysis may not factor in the latest price-sensitive company announcements or qualitative material. Simply Wall St has no position in any stocks mentioned.