ArcGIS Business Analyst Pro includes infographic capabilities that allow you to run infographics, batch-run infographics and reports, and build infographic and report templates. The infographic editing experience is available when you’re using a local data source and represents a major step forward in migrating work from ArcMap to ArcGIS Business Analyst Pro.
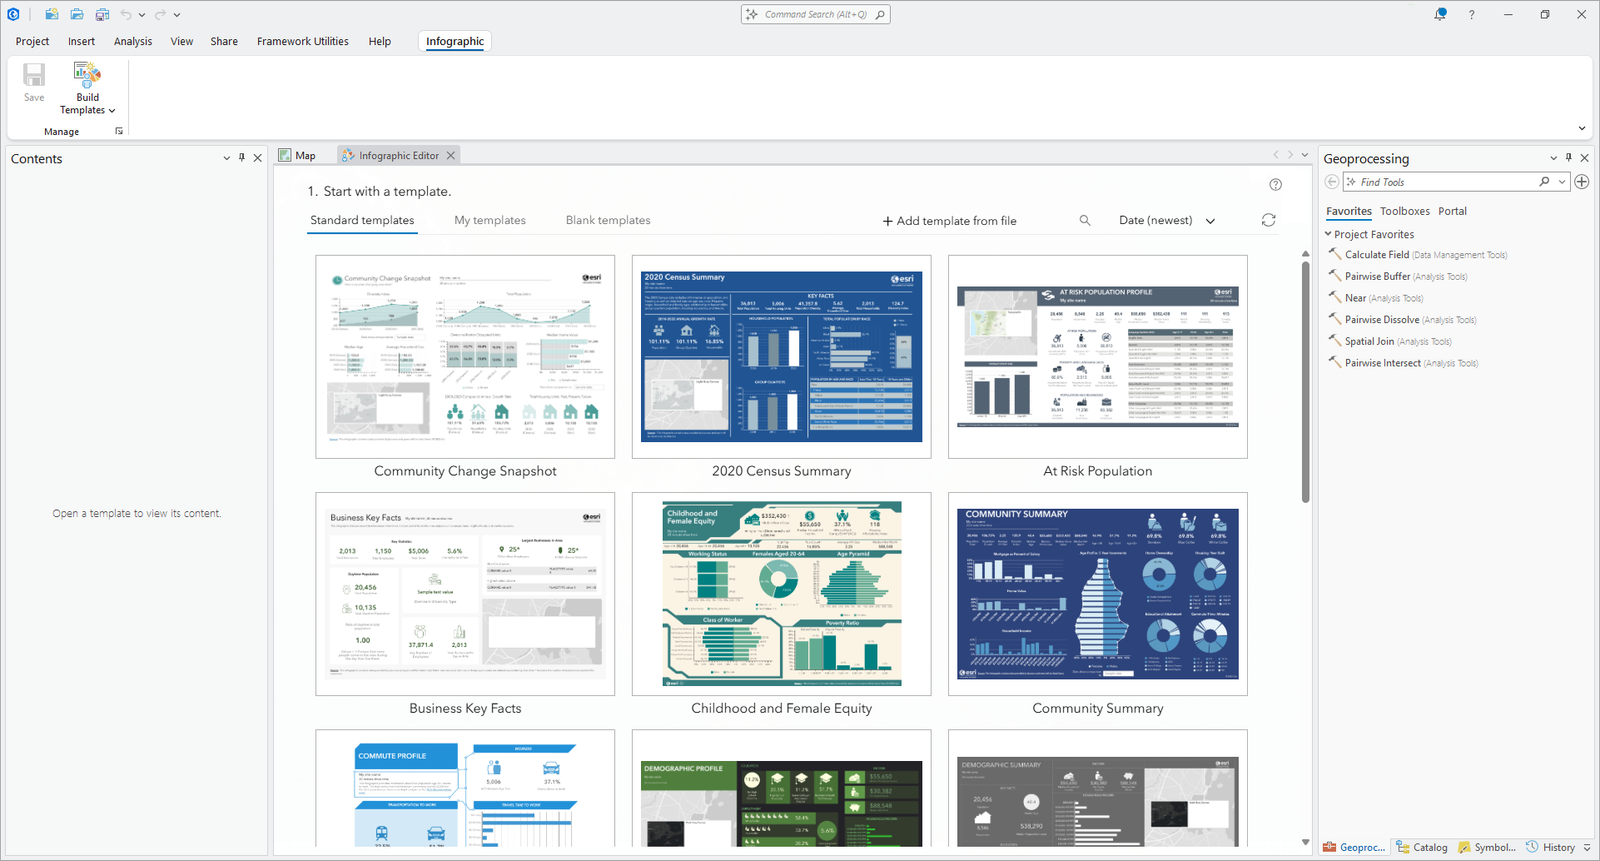
In addition to importing custom infographic and report templates from Business Analyst Web App, you can create custom templates entirely in ArcGIS Pro with a local dataset. When building and running templates in ArcGIS Pro, you can do the following:
- Combine Esri data and your data
- Build and run infographics disconnected from the internet
- Perform iterative exploratory analysis on any number of sites
- Run large processing jobs, such as running reports for thousands of locations across a country
- Include infographics as part of automated geoprocessing models
You can access the infographic editor from the Business Analysis gallery.
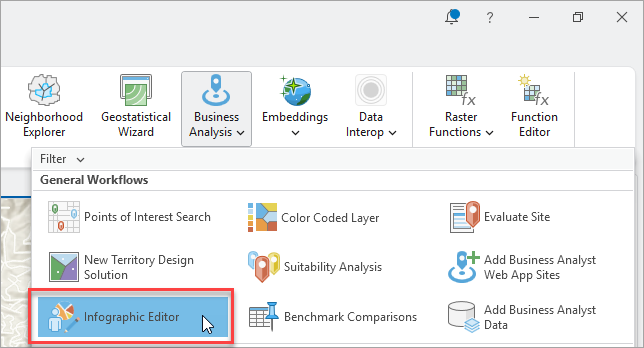
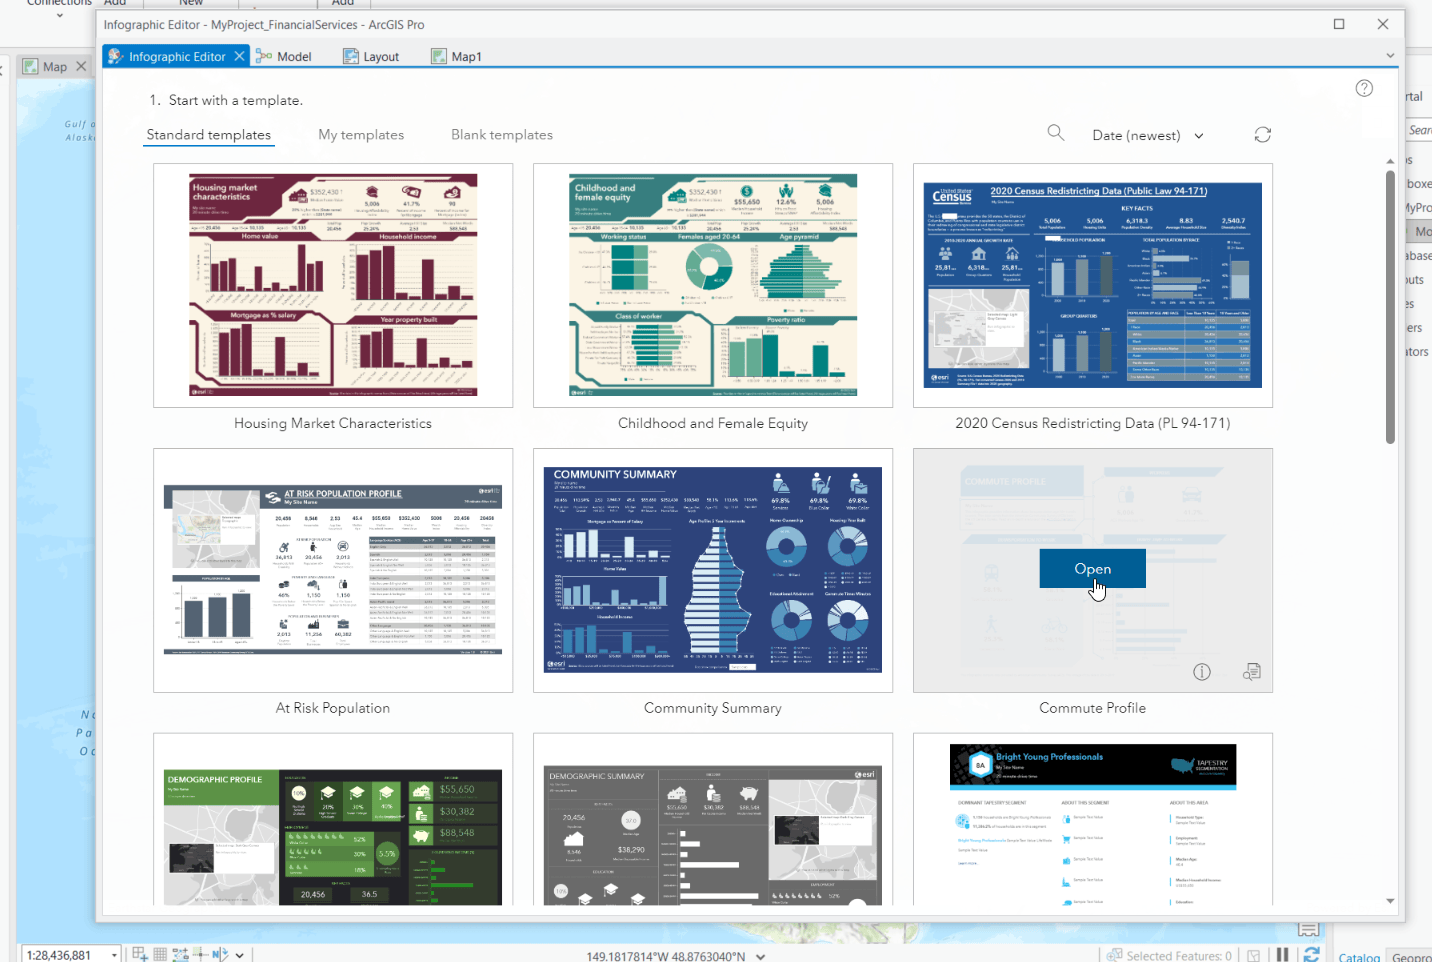
The editor opens in a new ArcGIS Pro view, similar to views for a map, model, Python notebook, or layout. You can float the view to full-screen for the best experience.
Once you’ve opened the infographic editor, you can choose from the following options to build infographic templates:
- Standard templates tab – Modify Esri’s predesigned templates
- My templates tab – Edit customized templates
- Blank templates tab – Build a template from scratch
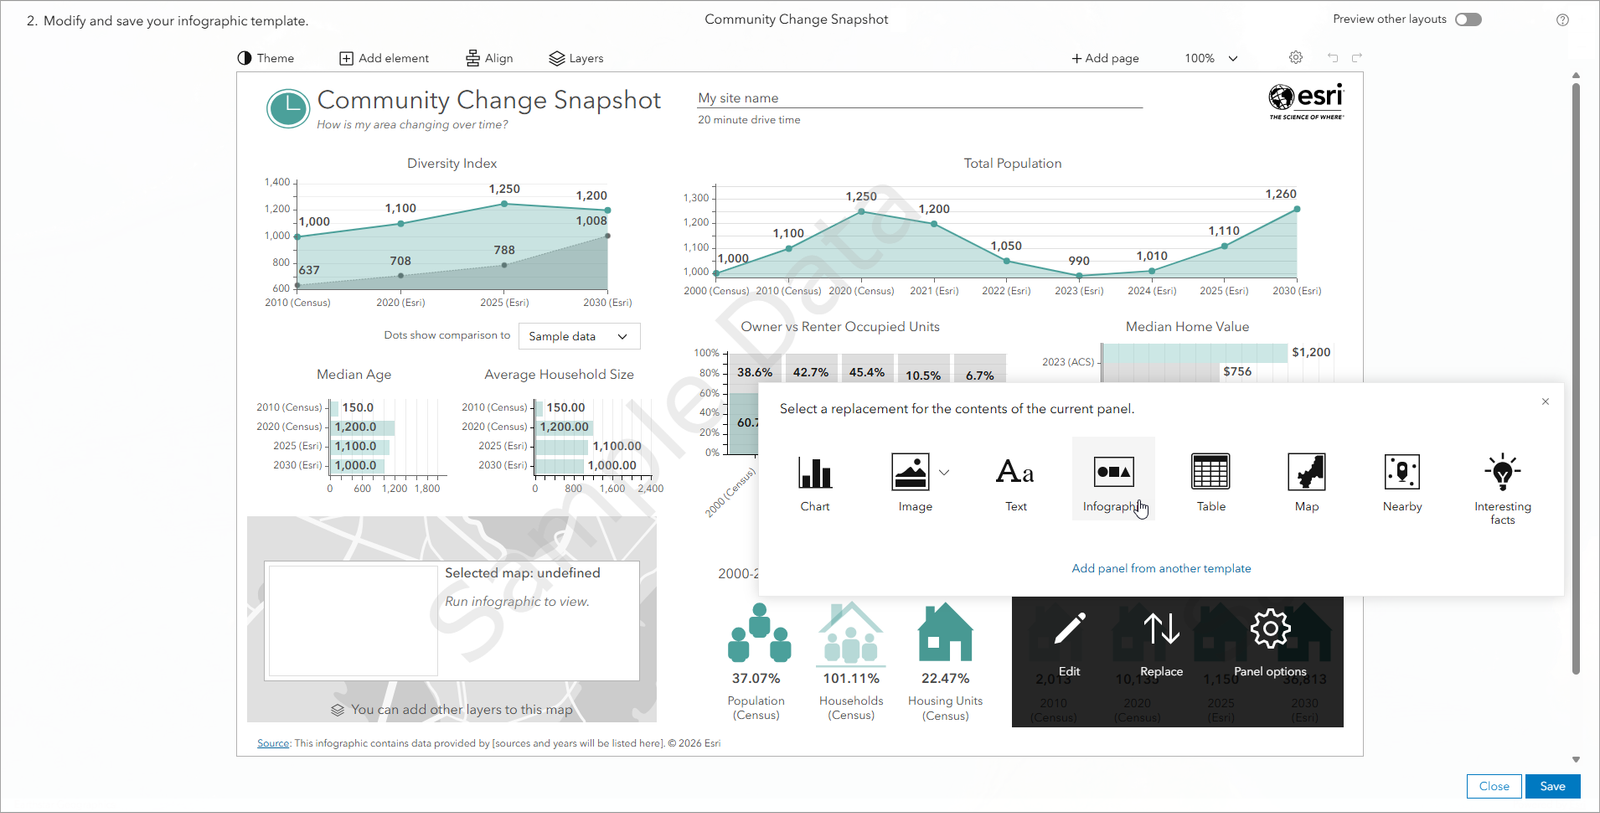
The following is an example of a standard infographic in the editing process. The editing options from Business Analyst Web App are now available in ArcGIS Pro, such as adding and modifying a chart, map, table, or image, and more.
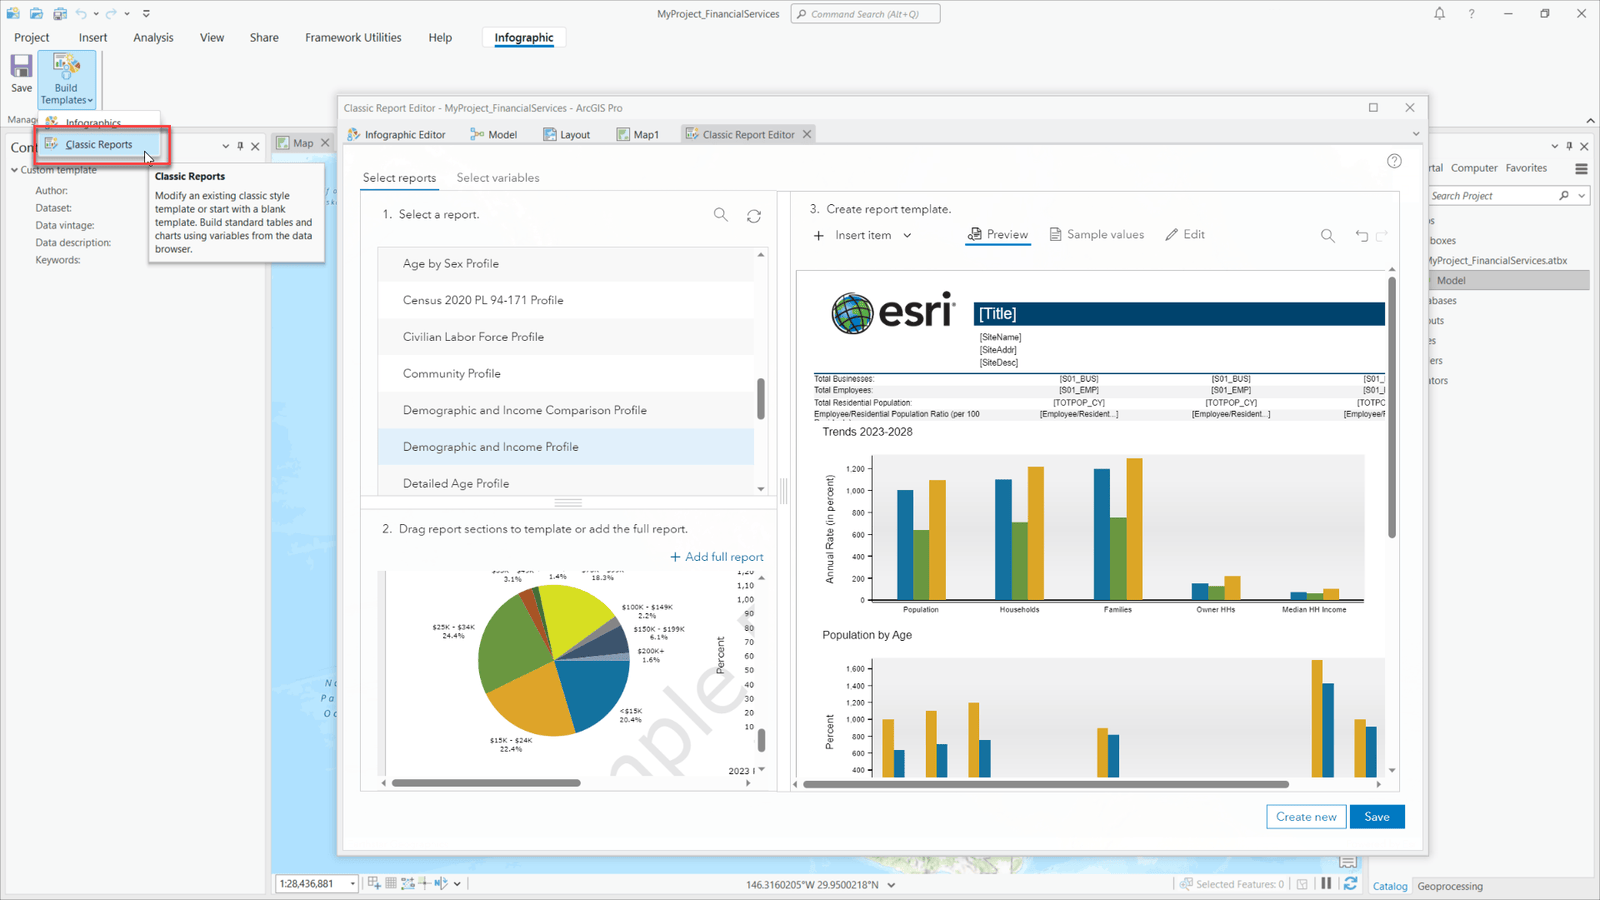
Aside from interactive infographic templates, you can also build and edit custom classic report templates. As an information product, infographic templates are a modern path forward: with interactivity, design capabilities, accessibility standards, and an improved editing experience but still build, maintain, and run classic summary reports. As such, you can now build and edit them in ArcGIS Pro.
To open the report editor, click the Build Templates drop-down menu and click Classic Reports.
Finally, you can use ArcGIS Pro to edit a custom classic report that was created in ArcMap.
We’ve created a sample Python tool that selects custom reports created in ArcMap and configures their settings to work in ArcGIS Pro. You can download the TemplateCoverter tool from Esri Knowledge Base and get started.
This article uses ArcGIS Business Analyst Pro 3.7.
Note: This article was updated on 5/28/26. The last previous update was on 12/8/23.
Resources
To continue your Business Analyst journey, visit the following resources: